The Month in Numbers – October 2012

We know that there is a huge divergence between the spending priorities of men and women. But how huge? Well, according to one U.K. survey, there is not a single item that can be found in both genders’ top-five lists. A study traces the history of credit cards all the way back to 3,000 BC. Half of the respondents to one survey admitted to freely sharing their cards’ PIN numbers with others. These are but a few of the more or less arguable statistics that have been presented in infographics and have made it into our monthly column. Oh, and you can view a list of the ten spookiest cyber attacks for 2012.
There is something about a well-done infographic that makes this type of a visual presentation of data so powerful and effective. I think it may have to do mostly with the sheer size of these graphs, but it may also be that people just spend more time and effort in creating them. Whatever it is, I am hugely grateful that so many people are willing to invest the time and effort it takes to research a subject and produce an infographic to illustrate your findings and I hope that this will keep being the case.
Now here are our picks for October 2012.
1. Men vs. Women: Spending Habits
Baines and Ernst has examined the spending habits of young British men and women and, unsurprisingly, has found quite a discrepancy between the two genders’ spending priorities. In fact, there is not a single item that can be found in both lists. Here is the comparison:

2. The History of Credit Cards
This is a favorite topic for creators of credit card infographics and we have published at least two of their efforts in the past year. This month’s entry comes to us courtesy of Credit Donkey. Similarly to Avid Trader, Credit Donkey has traced the credit card’s ancestors all the way back to 3,000 BC.

3. The Rise of M-Commerce
Shopify tracks the evolution of mobile commerce so far and outlines its expected trajectory in the coming years in an infographic. The one statistic that stood out at me the most was the complete dominance of the iOS among consumers who browsed Shopify stores from a mobile device in 2012: 80 percent vs. only 19 percent for Android-powered devices.

4. How Dwolla Works
Dwolla is a payment platform, which enables consumers to send money to other consumers and businesses. These are bank-to-bank transfers, rather than payment card-funded payments, which allows the company to provide the service at a very low cost to the end user: transfers under $10 are free and the ones above that amount cost the recipient $0.25. The company has created an infographic to illustrate the difference between its system and the credit card networks. Here it is:

5. 10 of the Spookiest Cyber Attacks of 2012
Red Herring has ticked off ten of the biggest cyber attacks of 2012. Unsurprisingly, the top spot is occupied by the Zappos attack at the very beginning of the year. Some of you will remember that the online retailer gave us a lesson on managing a data breach. Not everyone on Red Herring’s list coped quite as well with the problem, though.

6. How Safe Is Your PIN?
Backgroundcheck.org has taken a close look at the security vulnerabilities of our PINs and has found some interesting data to share with us. Half of the respondents to one survey admitted to freely sharing their PINs with others, we learn. Here is the infographic:

7. The High-Stake World of Mobile Payments
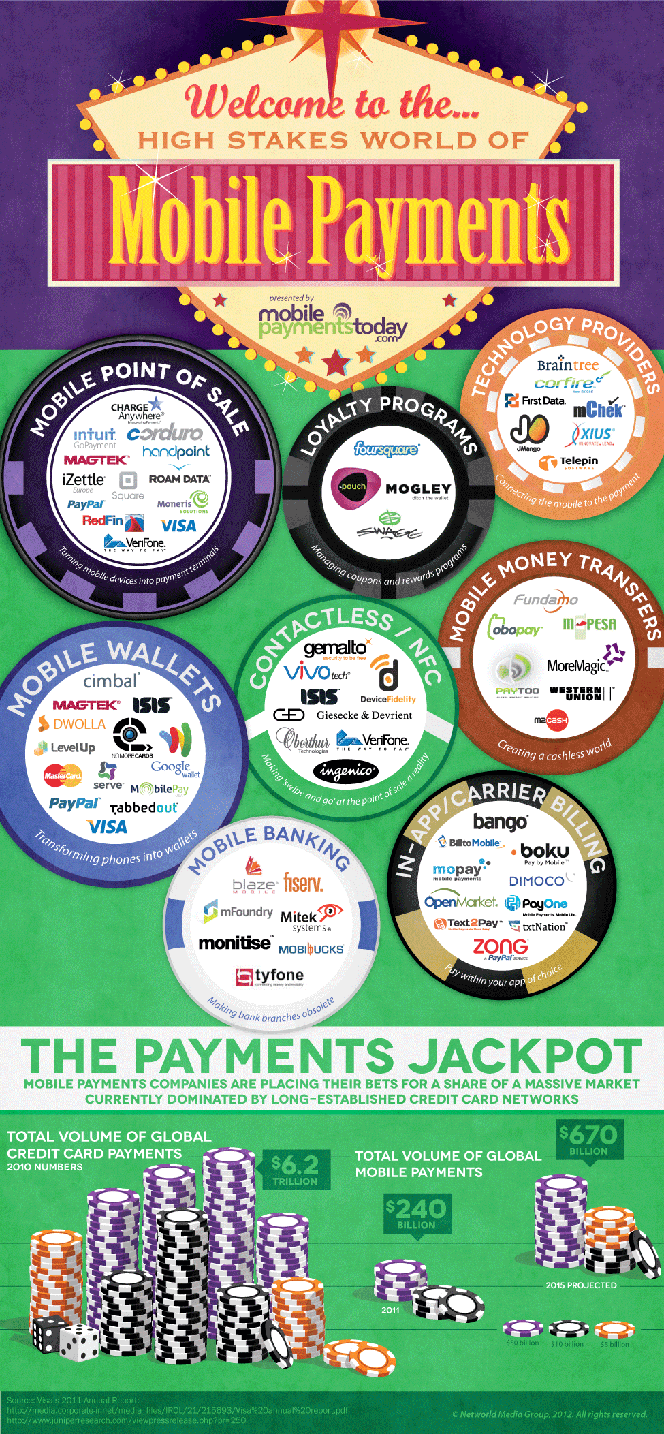
Mobile Payments Today has compiled a list of the companies that are vying for dominance of the various segments of the mobile payments industry, such as mobile wallets, point-of-sale payment processing, money transfers, NFC payments, carrier billing, etc. Here is the infographic they have created to present their findings:

8. Americans still Wary of Credit Card Debt
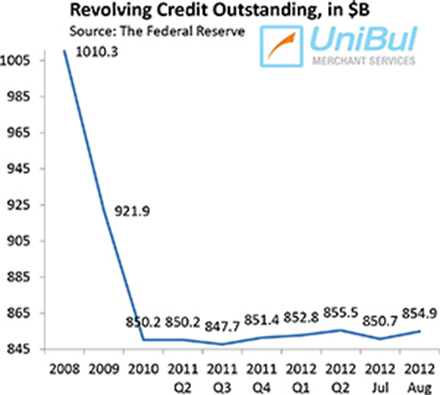
Following steep declines in the two previous months, the aggregate amount of outstanding consumer credit card debt in the U.S. rose in August by 5.9 percent, or $4.2 billion, from July’s level, lifting the total up to $854.9 billion, the Federal Reserve told us.

Image credit: Cedwvu.org.


