The Month in Numbers – January 2012
Infographics dominate the third edition of our new rubric — The Month in Numbers — which we started to give you the most interesting and newsworthy payment card-related statistics, news and art of the past month. Yes, I said art, because that is the only way I can describe some of the infographics below. Their creators have put their imagination to work and the results are amazing. I can only hope that they keep doing it.
Prepare yourself to have a lot of fun, as well as to learn about things you would never have thought about. I mean, did you ever think that the history of credit cards can go all the way back to 3,000 BC? Seriously? As always, we welcome your input and suggestions on what we should be including in our monthly compilation, so keep sending them in.
So here are our picks for January 2012.
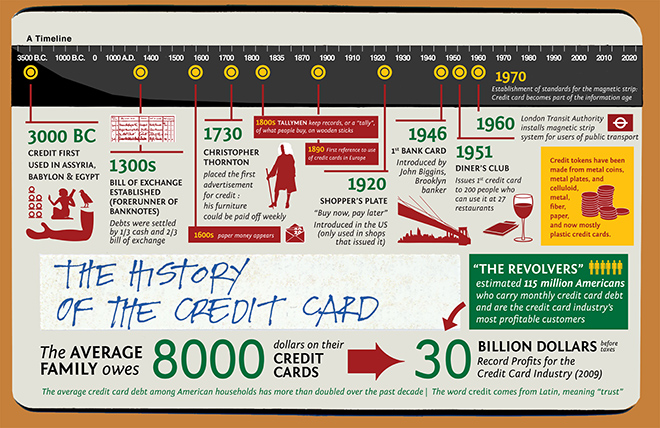
1. The History of Credit Cards
We could not have possibly passed on this one. Avid Trader has traced the history of credit cards for us all the way back to 3,000 BC in this awesome infographic.
2. What Happens to Your Debt After You Die?
Total Bankruptcy teaches us what can happen to our outstanding bills after we’re gone in this infographic.

3. The House That Credit Card Rewards Built
Credit Cards Canada has calculated that the average Canadian family accumulates about 97,500 redeemable points a year and then it goes on to tell us what these rewards could be used for in an awesome infographic.

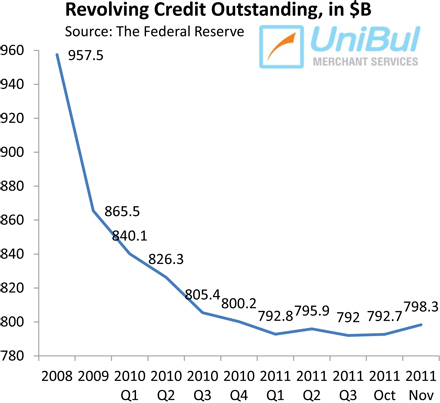
4. U.S. Consumer Credit Card Debt up at Fastest Rate since Lehman Fall
The latest Federal Reserve data revealed that the aggregate consumer credit card debt in the U.S. rose in November at the highest rate since the onset of the financial crisis.

And here is the chart for the movement of revolving credit — made up mostly of outstanding credit card balances.
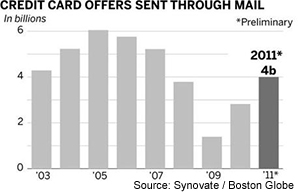
5. Americans Get 4B New Credit Card Offers in 2011
At four billion, the number of new credit card offers mailed out to Americans in 2011 was the highest one since 2007, according to data released by Synovate, a market research firm.
6. Credit Cards Can Be Your Defense against Super Bowl Fraud
As usual, Credit Donkey has an infographic on a timely topic for us. We are reminded of the protections credit cards provide against fraudulent charges and learn quite a bit in the process. For example, did you know that 69.5 percent of all Super Bowl-related consumer spending ($10 billion in total), goes to food and beverages?

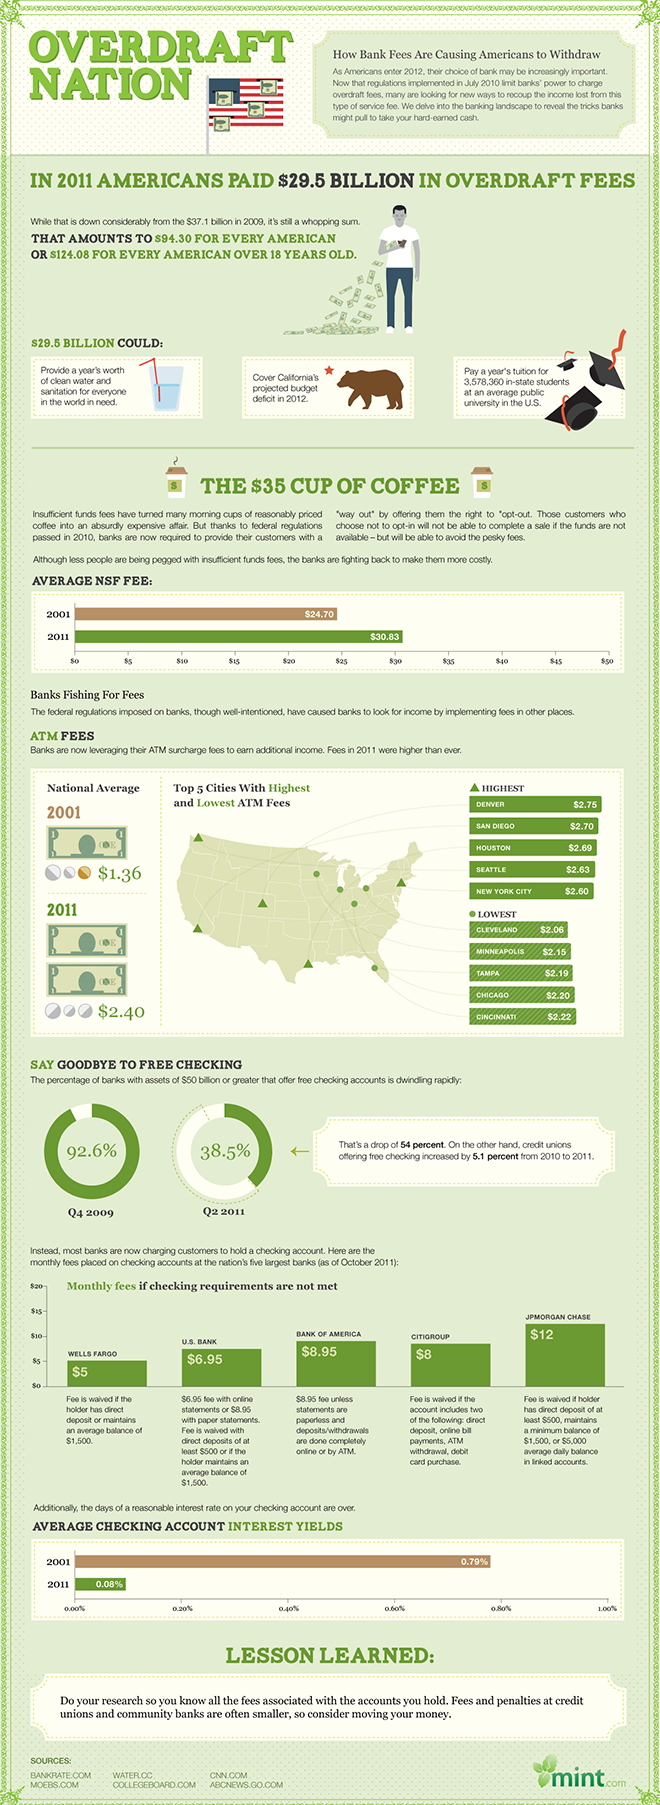
7. Americans Paid $29.5 Billion in Overdraft Fees in 2011
That is what we learn from a great infographic created by Mint.com. Put another way, $29.5 billion amounts to $94.30 per American or $124.08 per person aged 18 or older, Mint tells us.
8. U.S. Credit Card Delinquencies Hit an All-Time Low
The U.S. credit card delinquency rate fell to 2.91 percent in December, according to data from credit ratings agency Moody’s, the first time it has ever fallen below the three percent threshold.

Image credit: Creditcard.com.au.


