U.S. Savings Rate Dips as Demand for Consumer Loans Spikes

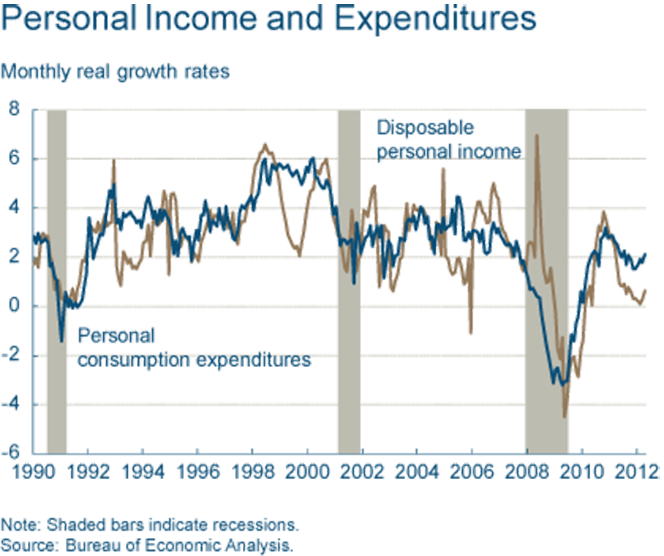
And we may just be warming up, warn Cleveland Fed economists O. Emre Ergungor and Patricia Waiwood. Household borrowing is on the rise again and the growth rate of consumption spending has been outpacing that of personal income since shortly after the worst of the financial crisis was behind us.
And yet, the U.S. consumer debt total is still declining, even as demand for new loans is spiking. Why? Because of historically low interest rates, the researchers tell us. Let’s take a closer look at their charts.
Debt Deleveraging, Demand for Credit and Income Growth
In drawing their charts, the two economists have relied primarily on data from the latest Federal Reserve Survey of Consumer Finances, released last month. Below I will show you some of them, but will also add a couple of graphs that I think are making their case even stronger.
1. Consumption expenditure growth outpaces that of personal income. That has been the case since the second quarter of 2009, we learn.
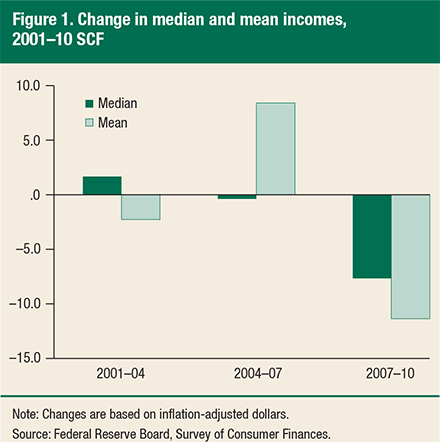
2. Family income falls. The Fed’s survey shows that in the 2007 – 2010 period, both the mean and the median family incomes have declined from the levels measured in the previous three-year period, by 11.1 percent and 7.7, respectively.
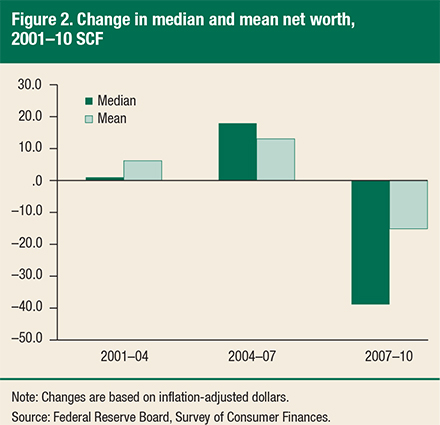
3. Net worth plummets. The declines in consumer incomes pale in comparison to the plummeting of both the mean and median net worth of American consumers, which fell by 14.7 percent and 38.8 percent, respectively. As you may expect, the collapse in house prices has been the main driver behind the decreases in net worth.
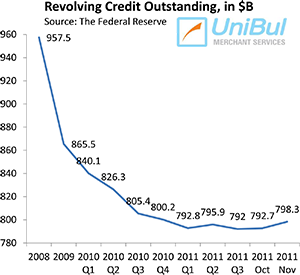
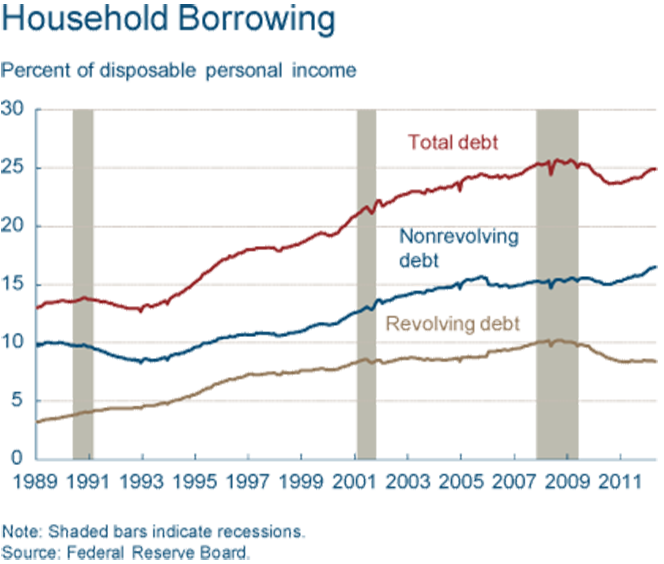
4. Household borrowing increases. Even as consumers’ incomes and net worths have been falling, borrowing is once again on the rise. While revolving consumer credit – primarily made up of outstanding credit card balances – has fallen considerably from its September 2008 peak, the aggregate amount of consumer borrowing is once again on the rise and is now right where it was when Lehman fell.
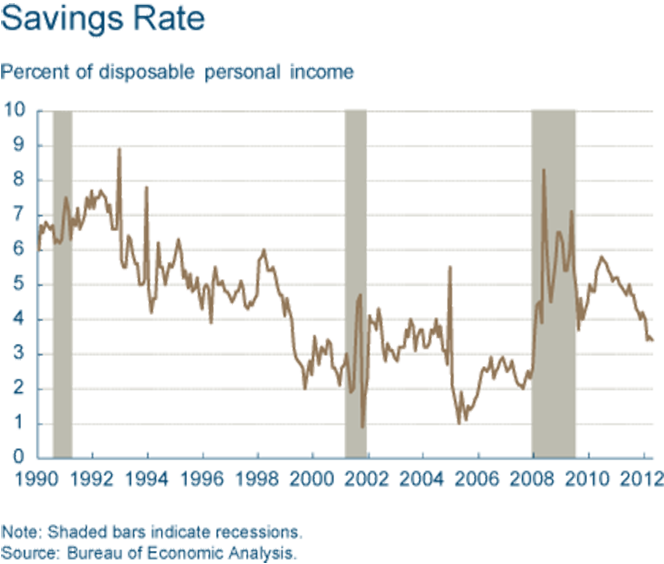
5. Savings rate dips. The U.S. household savings rate has fallen by half since it peaked at 6 percent in June 2010.
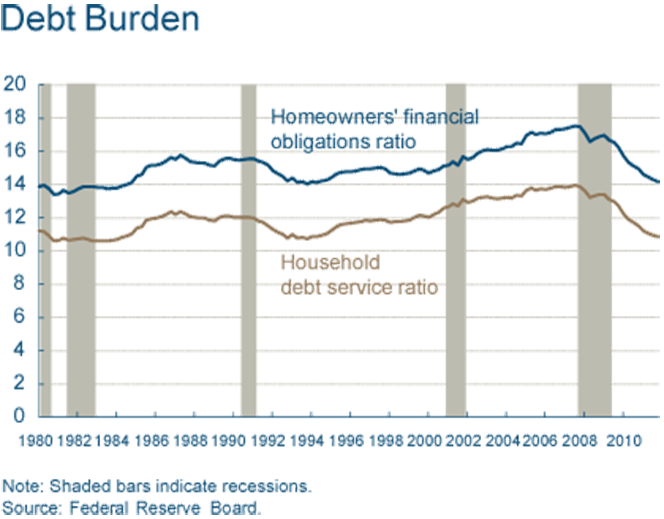
6. Household debt falls. Here is a trend that may seem counterintuitive. Consumer debt is still declining, even as Americans are borrowing more and saving less. How does that work? Well, as Ergungor and Waiwood remind us, the explanation is that interest rates are at an historic low, which makes the servicing of loans a much easier task.
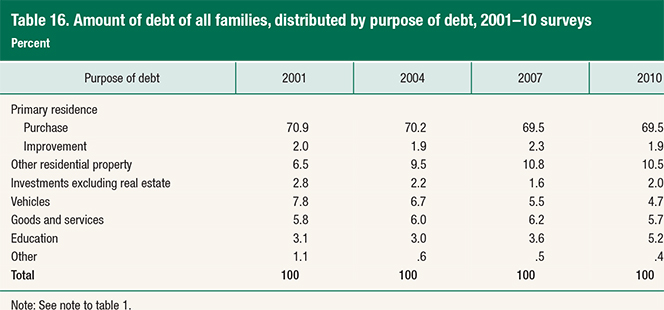
7. Most of consumer debt is used to purchase a home. No surprise here. However, it is worth noting that the share of debt owed for education has risen from 3.1 percent in 2001 to 5.2 percent in 2010. Moreover, the fraction of consumer debt attributable to education has now exceeded the share of borrowing for vehicles for the first time ever. Student loans are rightly receiving a great deal of attention these days.?á See our detailed review of the subject here.
8. Demand for new loans spikes. This one may be the most striking chart of the lot. It sure looks like consumers have finally overcome the deep fear of credit that was gripping them in the first two post-Lehman years.
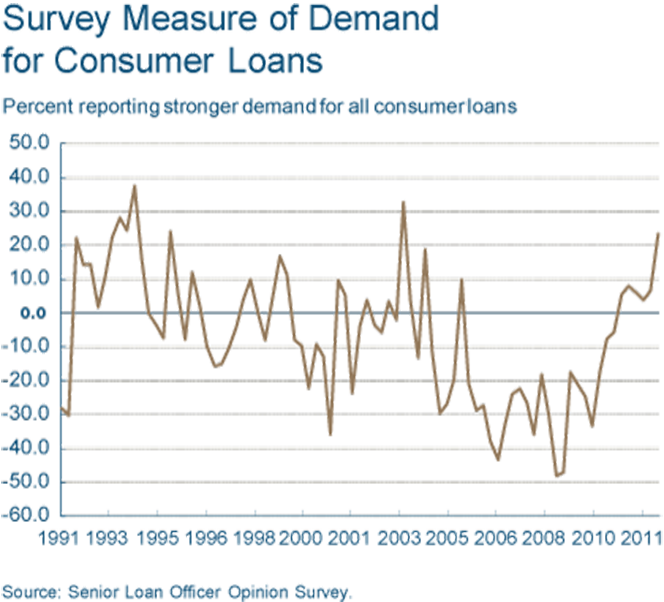
As Ergungor and Waiwood note:
Even though the events of the recent crisis are fresh in our collective memories, it looks like consumer debt markets may be getting ready to party like it’s 2003.
Indeed.
Image credit: Mkm-pi.com.
