U.S. Household Debt up by Most since 2007
Americans increased their overall indebtedness in the fourth quarter of last year once again, we learn from the latest Household Debt and Credit quarterly report, just released by the Federal Reserve Bank of New York. Though only the third increase in the past nineteen quarters, it was the largest quarterly increase in U.S. household debt since the third quarter of 2007. Moreover, between 2012 Q4 and 2013 Q4, aggregate household debt rose $180 billion, which is the first annual increase in outstanding debt since 2008, the report tells us. However, the total amount of household debt still remains well below the peak reached on the eve of Lehman’s collapse.
Both the home-mortgage and non-housing components of the debt total rose by healthy amounts in the quarter, with the expansion in the latter category once again driven primarily by gains in auto and, especially, student loans. However, aggregate outstanding credit card balances also rose by a healthy amount. The only category in which the debt total fell, for a second consecutive quarter, was the home equity lines of credit (HELOC).
Using data from Equifax, one of the three national credit reporting agencies, the NY Fed reports that the number of consumers with a bankruptcy notation on their credit files fell substantially from the previous quarter’s level and, more importantly, it was slightly lower than the total of 2012 Q4. Yet, compared with the pre-recession period, bankruptcy notations remain at a considerably elevated level. That, however, was not the case with foreclosures: the number of new foreclosures added in 2013 Q4 was the lowest since 2005 Q2 and is expected to keep falling.
The overall delinquency rate also continued to fall and is now at its lowest level since 2007 Q4. The only credit category whose delinquency rate rose was credit cards. Even the student loan delinquency rate dropped, although it still remains very high. Let’s take a closer look at the latest numbers.
U.S. Consumer Debt up by $241B
The NY Fed reports that, as of December 31, 2013, the aggregate amount of U.S. household debt was $11.52 trillion. That is up by $241 billion (2.1 percent) from the corresponding total recorded at the end of the previous quarter and $180 billion (1.6 percent) higher than the 2012 Q4 level. Yet, as the authors point out, the new total is still lower by $1.16 trillion (9.1 percent) than the all-time high of $12.68 trillion reached in the third quarter of 2008, at the end of which the collapse of Lehman Brothers set off the financial crisis.
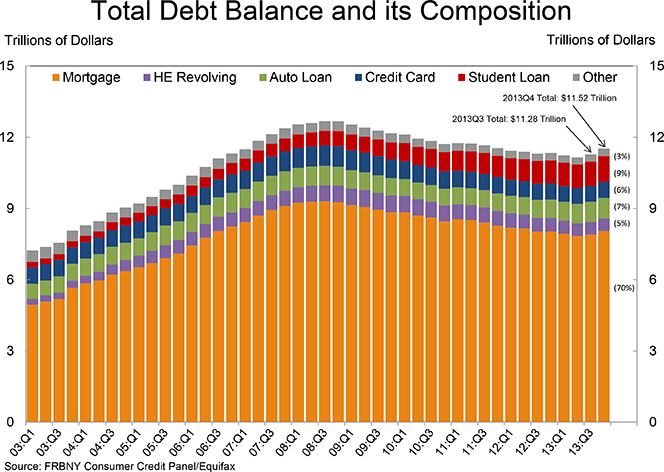
The overall delinquency rate also fell considerably in 2013 Q4, the ninth consecutive quarter of improvement. As of the end of December, 7.1 percent ($820 billion) of all outstanding household debt was in some stage of delinquency, down from 7.4 percent ($831 billion) in the previous quarter and from 8.6 percent in 2012 Q4. About 71 percent of the delinquent total — $580 billion — was “seriously delinquent”, meaning at least 90 days past due, down from $600 billion in the previous quarter, the NY Fed tells us.
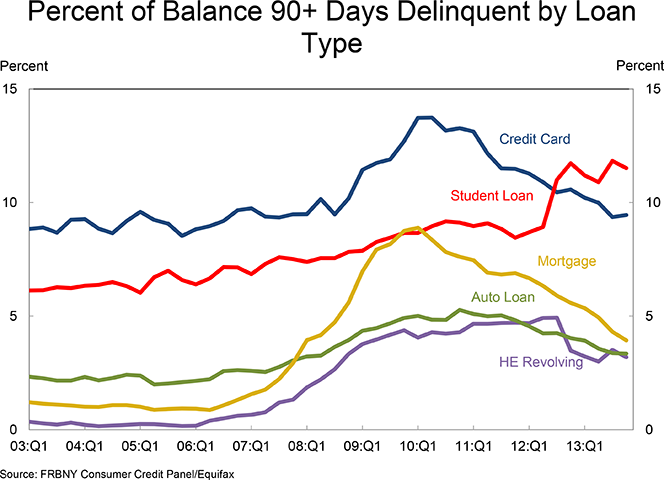
As you can see in the chart below, the delinquency rates of most consumer loan types monitored by the NY Fed, including mortgages and even student loans, fell. However, credit card delinquencies rose.
Mortgages, Credit Card Debt, Student and Auto Loans Up
Now here are the latest data for mortgages, credit cards and student and auto loans.
Mortgages
- Originations, or new mortgage balances that appeared on consumer credit reports in the quarter, dropped to $452 billion from $549 billion in the previous quarter.
- About 157,000 consumers had a new foreclosure notation added to their credit reports during the fourth quarter, down from 168,000 in the previous quarter and the lowest total recorded since 2005 Q2.
- The share of mortgage balances late by 90 days or more was 3.9 percent in the quarter, down from 4.3 percent at the end of 2013 Q3 and was the lowest level recorded since the fourth quarter of 2007 (2.9 percent).
Credit Cards
- Aggregate credit card limits were up by $70 billion from the previous quarter’s level to $2.905 trillion. That is still down by 21.5 percent ($795 billion) from the peak of $3.7 trillion measured in 2008 Q3.
- Available credit was up by $59 billion to $2.222 trillion, but is still down by 21.8 percent ($620 billion) from the 2008 Q3 high of $2.842 trillion.
- The number of open credit card accounts rose by 7.8 million to 399.0 million, a level that is still 19.6 percent (97 million) below the 2008 Q2 peak of 496 million.
- Outstanding credit card balances rose by $11 billion to $683 billion, still 21.1 percent ($183 billion) below the 2008 Q4 peak of $866 billion.
- The share of credit card balances delinquent by 90 days or more increased by 9 basis points to 9.45 percent — still the second-lowest level since 2007 Q3.
Student Loans
- The student debt total rose by $53 billion to $1,080 billion, which is up by 76.8 percent ($469 billion) from the $611 billion level of Q3 2008. For the year, the increase was $114 billion.
- Since the peak of household debt in 2008 Q3, the student debt total has increased by $469 billion, while the other forms of debt have fallen by a combined $1.6 trillion.
- The share of the student debt total delinquent by 90 days or more fell to 11.51 percent in 2013 Q4 — still the third-highest level ever recorded.
Auto Loans
- The auto loan total was up by $18 billion in the quarter to $863 billion — a new all-time high. For comparison, the pre-crisis high, recorded in 2005 Q2 was $830 billion. In 2013, auto loan debt has increased by $80 billion.
- New auto loan originations decreased to $88 billion from $97.4 billion in the previous quarter.
- The share of auto loan balances delinquent by 90 days or more fell by another 2 basis points to end the quarter at 3.35 percent — the lowest level since 2008 Q2 (3.26 percent).
For a second quarter in a row, aggregate HELOC balances were the only ones to fall, this time by $6 billion from the previous quarter’s level.
The Takeaway
In a blog post, four NY Fed researchers are telling us how they interpret the latest data. They see two things standing out. First, consumer debt has grown at a considerably slower pace in 2013 than it did in 2006, with the exception of auto loans, which grew strongly in 2013, and student loans. In the case of student loans, the growth rate has moderated since 2006, but as the outstanding balance has doubled, “the lower percentage growth is associated with comparable dollar increases”. Mortgage and HELOC balances, in particular, grew much more slowly in 2013 than in 2006.
The NY Fed researchers’ second observation is that, for all loan types and in both years (2006 and 2013), debt growth was mainly driven by younger consumers. Once again, however, student loans are the exception, for even older student loan borrowers continue to increase their borrowing.
Then they look into the mortgage and HELOC balances, but this time by credit score groups. They find that, “in 2013, balances fell for the lowest credit score borrowers — the result of charge-offs from previous foreclosures — while all groups, even those with subprime credit scores, increased their mortgage balances in 2006”. In 2013, by contrast, the modest mortgage balance increases are mainly coming from high credit score borrowers. Similar is the credit card picture.

When it comes to student loans, they grew the most of any debt category in both periods. Their growth, as you can see in the chart above, like that of auto loans, is concentrated among the lower and middle credit score groups. Yet, it was not the growth in student and auto loans that led to an increase in the aggregate debt amount:
But auto and student loans have been growing for some time, while overall debt continued to fall. In 2013, the increased credit card and mortgage debt among the young and the riskless led to a turnaround in the trajectory of overall debt.
Yet, it is growth of student debt that is the most troublesome, as it is shadowed by a sustained rise of delinquency and default rates, which is not the case with the other debt types.
Image credit: Flickr / LendingMemo.
While the US Federal Reserve spins these numbers as signs of economic recovery, those less divorced from reality recognize this as continuing signs of desperation ?Çô using credit just to get by – by consumers still reeling from the Financial Crisis and Great Recession. The same consumers whose tax dollars went to bailout the mega-banks that precipitated the Crisis, instead of being used to ameliorate the damage caused by these casino-like financial behemoths.