The Grey Side of Credit Cards Costs Us $14.3B
That is how much Americans paid in 2012 in “fees and charges they never wanted or intended to pay”, a new report (you have to fill out a form to get it) produced by financial services consultancy Aite Group for BillGuard — a personal finance protection company — tells us. Grey charges come in different shapes and form and you will find at least some of them familiar, for example the “free-to-paid” scheme in which you receive a service for free for a trial period and then get charged for it if you don’t cancel the subscription.
I would note, however, that at least in one case some of the practices under examination have already been found to be unlawful by the Consumer Financial Protection Bureau (CFPB). You may recall that a year ago the consumer watchdog fined Capital One $60 million and forced the issuer to refund $150 million more to its cardholders for engaging in deceptive practices employed when consumers were calling the bank’s call centers to activate their new cards. These practices involved getting cardholders to sign up for services like payment protection and credit monitoring by, for example, leading consumers to believe that these things are free or that by doing so they would improve their credit scores or by not telling them that these things are optional. As someone whose credit history was (briefly) blemished by such a charge, I can only hope that other issuers who offer such services get the same treatment, so that they clean up their acts. But let’s take a look at the report’s findings.
What Are Grey Charges?
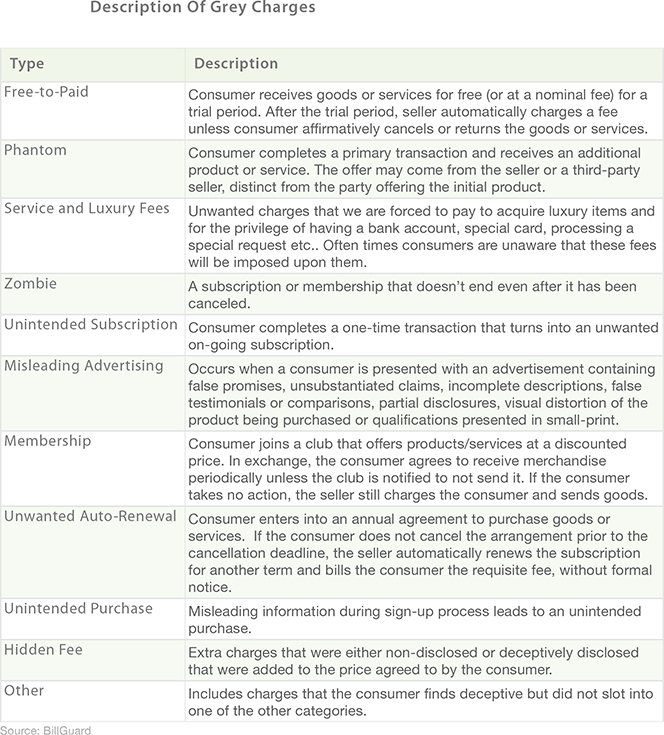
The report defines “grey charges” as “deceptive and unwanted credit and debit card charges that occur as a result of misleading sales and billing practices”. These are not technically illegal, although, as the Capital One case indicates the line is fairly amorphous. There are many different shades of grey, as shown in the table below.
Grey Charges Cost Us $75, on Average
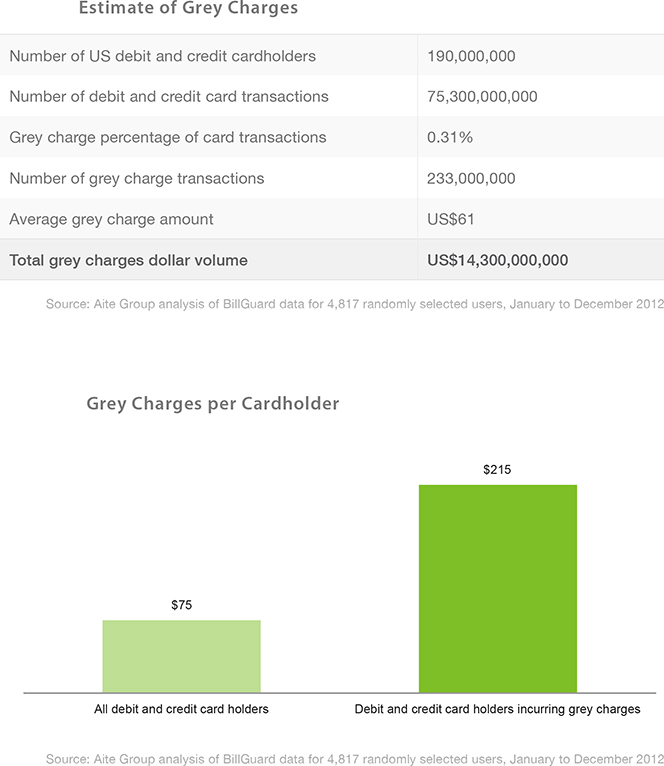
At 233 million, the total number of grey charges in 2012 is staggering — that is 0.31 percent of all credit and debit transactions conducted that year in the U.S. (75.3 billion). On a per-cardholder basis, the average grey charge was $75 and if you only consider cardholders who actually paid such a fee last year — 35 percent of all — the average was three times as high — $215.
Shades of Grey
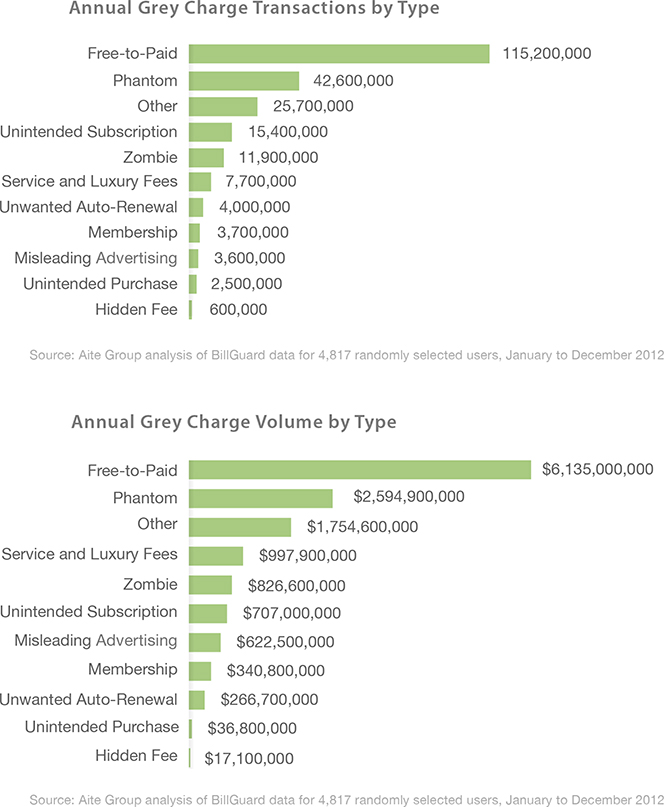
The “free-to-paid” type of scheme is far and away the leader of the grey pack, accounting for more than 115 million charges and more than $6 billion in volume last year. Here is the full breakdown by type:
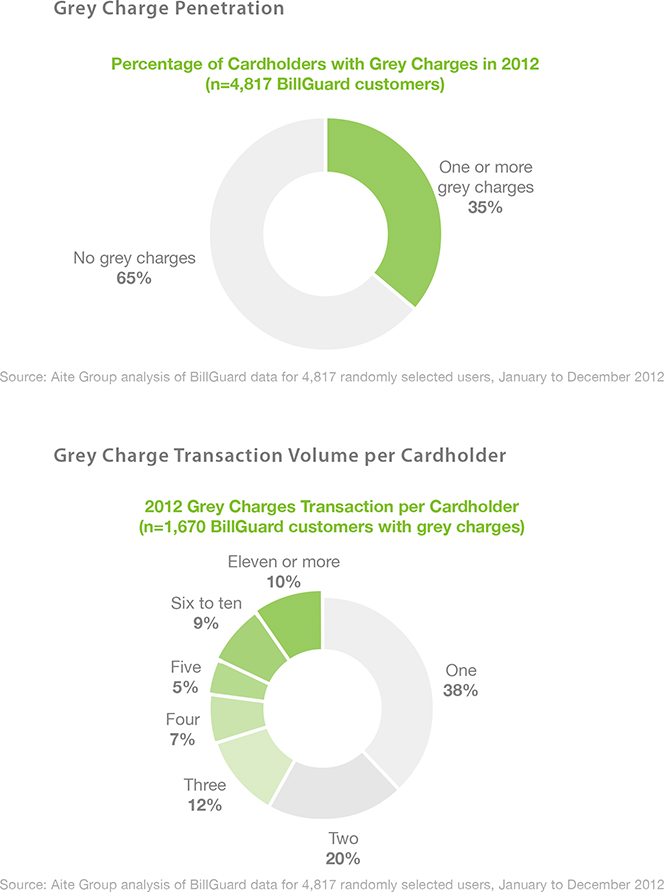
35% of All Cardholders Pay Grey Charges
This is an incredibly high ratio. Moreover, 10 percent of cardholders who actually incurred such fees in 2011 paid 11 of them or more.
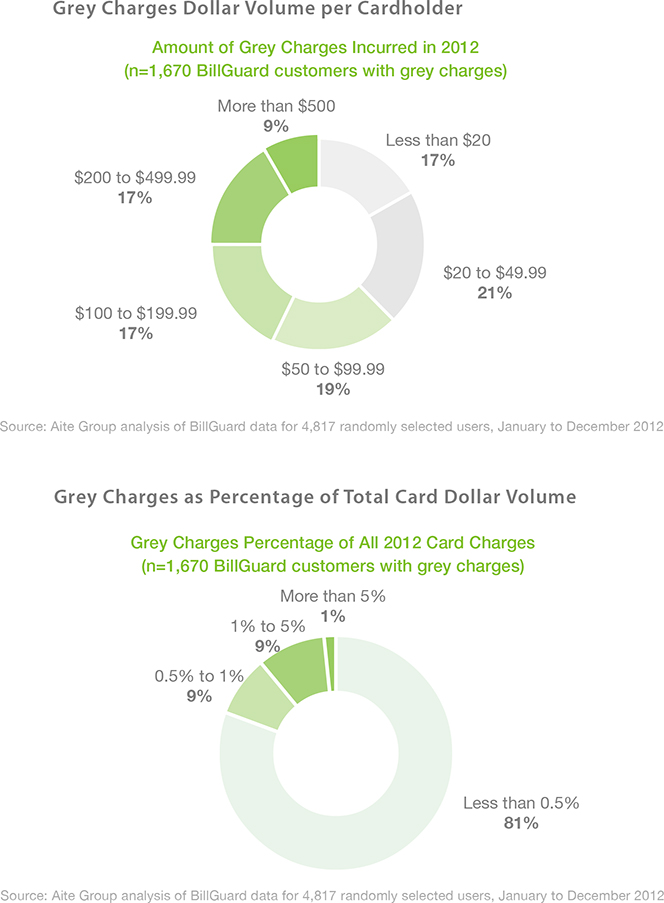
9% of Cardholders with Grey Charges Pay More than $500
That is also an astonishing statistic. Another is that about a third of cardholders with such charges paid between a $100 and $500 in 2012.
Discover Is the Greyest Card Issuer
Discover has the highest ratios of grey transactions — 0.21 percent — and grey volume — 0.09 percent — among the seven issuers named in the report. Wells Fargo was a close second in the former category and American Express equaled Discover’s achievement in the latter.

Card Issuers Pay $562M in Grey Charge-Related Costs
The Aite researchers have found that, whereas card issuers have generated an estimated $214 million in interchange fees on grey transactions last year, they have incurred $562 million in service-related costs. But then, a significant portion of the $14.3 billion grey total would have been collected by the issuers, so I don’t think they are actually losing money on this.
The Takeaway
For the most part, the services for which these grey fees are charged are either completely unnecessary or otherwise available for free elsewhere. And in any case, even if you do believe that one of these products is worth paying for, you would almost certainly be able to get a better deal for it elsewhere. So do yourself a favor and never subscribe to any add-on service offered to you by your credit card company. Finally, here is an infographic produced by the researchers to go along with their report:

Image credit: Flickr / Josh Kenzer.

