How Cyber Monday Eclipsed Black Friday
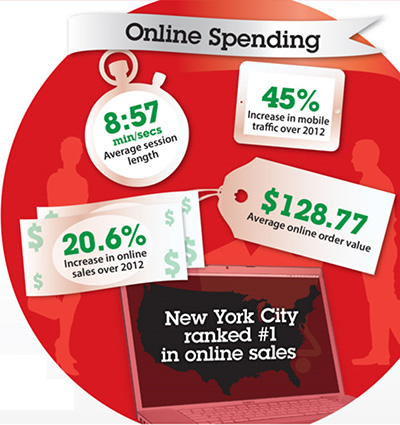
As you’ve probably learned by now, Cyber Monday 2013 was the biggest online shopping day in history. And it didn’t just set a new record, but it completely destroyed the old one: this past Cyber Monday’s online sales volumes grew by more than a fifth from the previous year’s level, we learn from IBM’s 2013 Holiday Benchmark Reports. Moreover, Monday capped the highest online sales period ever recorded — from Thanksgiving through Cyber Monday — whose volume grew by 16.5 percent on an annual basis.
The same five cities, which topped the online sales list on Black Friday were leading the Cyber Monday chart, but this time in a different order. New York was number one, ahead of Washington D.C., Los Angeles, Chicago and Atlanta. Here are some of the more interesting stats from IBM’s Cyber Monday report.
Cyber Monday 2013 by the Numbers
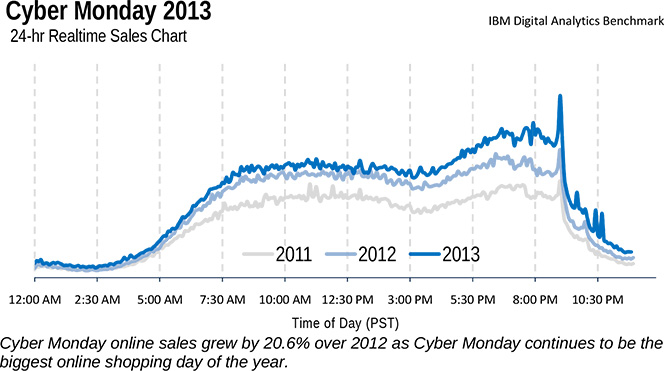
1. Online sales set a new record. Cyber Monday 2013’s online sales grew by 20.6 percent over 2012’s total, even though the average order amount — $128.77 — went down by 1 percent.
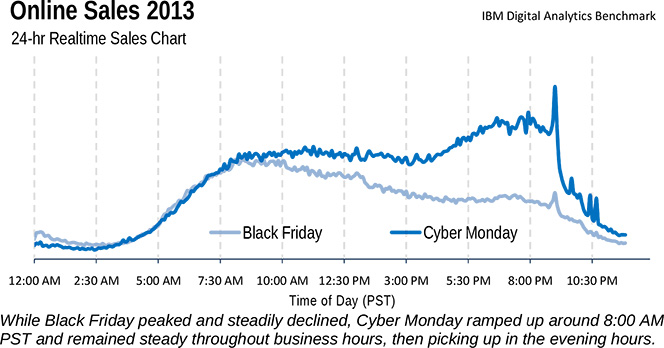
2. Sales remained steady throughout the day. Online sales peaked at 9:05 AM PST on Black Friday and then gradually declined. By comparison, as you can see in the chart below, online sales on Cyber Monday mirrored Black Friday’s trend in the early hours, but then remained high during the whole day and in fact peaked even higher around 9 PM.
Here is how Cyber Monday 2013’s sales chart compared to its two most recent predecessors:
3. Mobile sales grew to 17 percent of the total online sales. That was an increase of 55.4 percent from last year. Mobile traffic also grew strongly, to make up 31.7 percent of all online traffic — a 45 percent increase over Cyber Monday 2012.
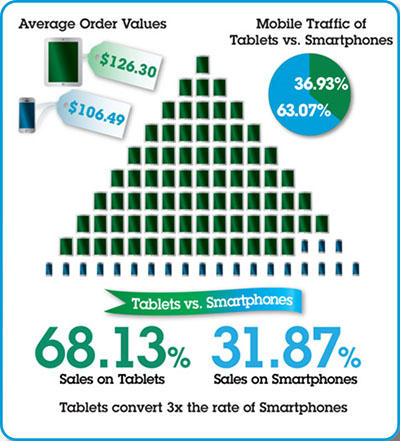
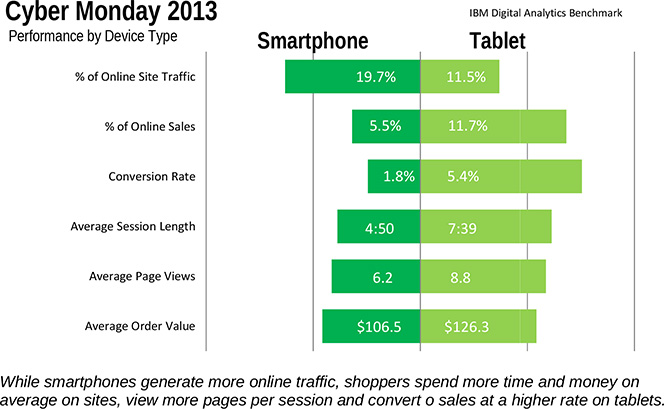
4. Smartphones browse, tablets buy. The trend from Thanksgiving / Black Friday held on Cyber Monday: smartphones comprised 19.7 percent of all Monday’s online traffic, compared to tablets’ 11.5 percent; however, tablets accounted for 11.7 percent of all online sales, more than twice the share of smartphones (5.5 percent). Moreover, we learn, the average tablet transaction was 18.6 percent higher, in dollar terms, than the average smartphone one: $126.30 versus $106.49. Here is the headline comparison:
And here is a more detailed breakdown:
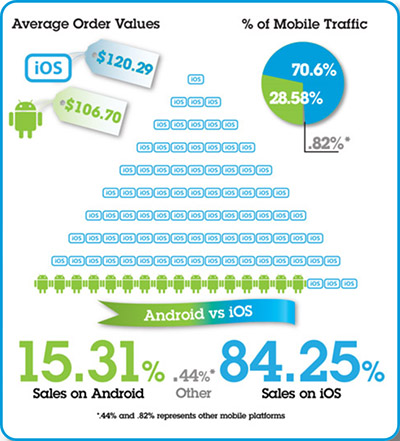
5. iOS defeats Android… as was the case on Thanksgiving / Black Friday. The average iOS user spent 12.7 percent more on Cyber Monday than her Android counterpart — $120.29 per order compared to $106.70. Furthermore, iOS sales comprised 14.5 percent of all online sales, five-and-a-half times Android’s share of 2.6 percent. Finally, iOS traffic made up 22.4 percent of all online traffic, more than twice Android’s share of 9.1 percent.
6. Pinterest vs. Facebook. In a sharp reversal from Black Friday, shoppers referred from Facebook spent 6 percent more money, on a per-order basis, than those referred from Pinterest. Furthermore, Facebook’s average order amount was $97.81, higher by 6 percent than Pinterest’s average of $92.40. Finally, Facebook’s referrals converted into sales at a rate that was 38 percent higher than Pinterest’s.

Cyber Monday vs. Black Friday
Here is how the two online shopping days compared this year:
1. Cyber Monday’s sales were higher by 31.5 percent. However, Cyber Monday’s average transaction amount was 5 percent lower than Black Friday’s: $128.77 compared to $135.27.
2. Mobile sales and traffic decreased on Cyber Monday, by 21 percent and 20 percent, respectively, from Black Friday’s levels. Of course, the other side of this medal is a huge increase in laptop and desktop sales and traffic, but IBM doesn’t give us the numbers for those.
3. Cyber Monday’s shopping cart conversion rate was 12.6 percent higher. The authors explain that discrepancy with shoppers’ desire to “lock in the best deals”. That doesn’t sound convincing to me: shoppers didn’t want to “lock in the best deals” on Black Friday — the day that is supposed to offer the best deals?
The infographic below shows you how four of the top retail categories did this Cyber Monday, compared to the previous one (data, again, from IBM).

Here you can play with a nice interactive infographic put together by the researchers to illustrate their results.
Image credit: Flickr / Geoff Livingston.
