Americans Revert to Valuing Mortgages Higher than Credit Cards

TransUnion has just released the fourth update to its 2010 Payment Hierarchy study, which has been monitoring the shifting consumer debt repayment preferences following the financial crisis of 2008 and the meltdown of the housing market. Measuring the proportion of American homeowners who are current on their credit card payments, but are at least 30 days late on their mortgage payments, TransUnion’s research showed that consumer preference for repayment of credit card debt over mortgages, a type of behavior never seen before, was observed in the first quarter of 2008.
The reversal, on a national level, only came in September of last year, more than five years after the trend had begun, and now TransUnion tells us that the shift to the “normal” type of payment prioritizing is taking hold. One interesting feature of this process is that the shifts in consumer mortgage and card repayment priorities has had little effect on their treatment of auto loan payments, which have enjoyed the highest status in Americans’ debt repayment hierarchy since “at least 2003”.
The researchers interpret their latest findings as confirming the proposition they had previously advanced, according to which the shift — rising or declining — in home prices correlates strongly with consumer debt repayment preferences. I would add, however, that the increase in the past year in consumer attention to keeping home mortgages current hasn’t done any damage at all to the health of Americans’ credit card accounts. On the contrary, both the credit card delinquency and default rates are at record-lows and Americans are paying back more of their outstanding card balances at the end of each monthly cycle than they have ever done. But let’s take a look at the latest TransUnion data.
The Data: Delinquencies Are Falling Fast
TransUnion’s study examines the responsiveness of Americans’ debt repayment behavior to periods of both home price depreciation and of significant appreciation over the past decade. Included in the sample were consumers who had at least one active credit card account and one open mortgage and one auto loan (they had to have all three types of accounts to be included in the survey), all in good standing at the time of the study. The researchers measured the share of these consumers who were delinquent by 30 days or more on one of these three debt categories and here are the national averages:
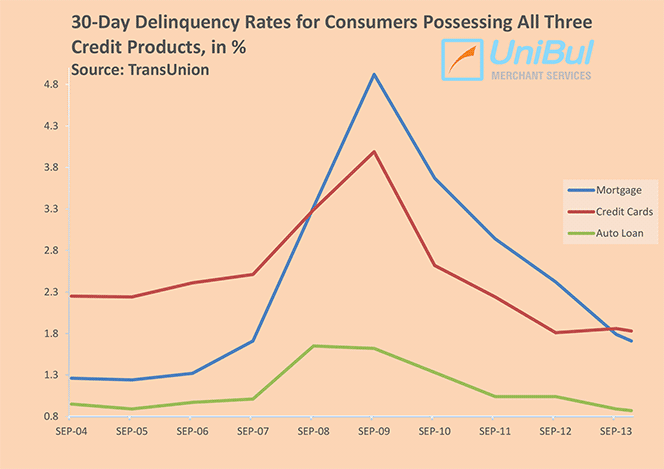
As you can see, among consumers who have all three loan types on file with TransUnion, the mortgage delinquency rate had reached that of credit card delinquencies sometime in the second half of 2013, then has fallen below it and it remains on a downward trajectory. According to Ezra Becker, co-author of the study and vice president of research and consulting for TransUnion, it’s all about unemployment and the health of the housing market:
As unemployment rose and home prices cratered, increasingly more consumers were faced with financial constraints and had to make difficult choices — and many chose to value their credit card relationships above their mortgages. This was a measurable result of the economic environment, wherein many consumers were underwater on their mortgages and at the same time needed the liquidity afforded by credit cards to make ends meet.
As Becker had previously observed, consumer payment delinquency behavior appears to be driven by the movements of the home prices and is going through three phases: rapid increase, stabilization, and rapid decrease. The credit card payment delinquencies appear to have stabilized, whereas home mortgages are still going through the third of these phases.
How Home Prices Impact Delinquencies
To determine the size of the impact that home prices have had on credit card delinquencies, the researchers have looked at the delinquency spreads between mortgages and credit cards over the past decade and have compared that spread to the Standard and Poor’s Case-Shiller 20-city Home Price Index (HPI). For example, if the 30-day credit card delinquency rate is 1.50 percent and the 30-day mortgage delinquency rate is 2.25 percent at a given point in time, the spread between the two variables is 0.75 percent. Unfortunately, the researchers have not given us the latest data, but here is how that comparison looked up until December 2012:
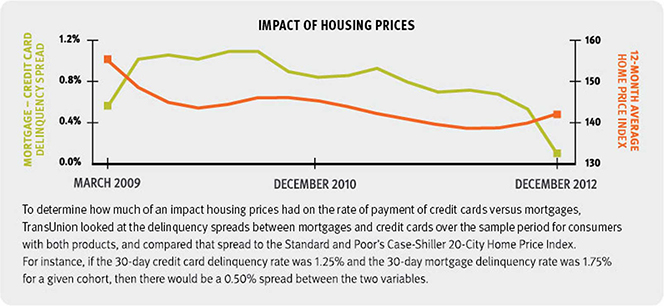
Since then, the delinquency spread has turned negative (mortgage delinquencies are now lower than credit card delinquencies), while the HPI has continued to rise, and at a faster clip. So what’s the correlation? Well, here is how Toni Guitart, another co-author of the study and director of research and consulting in TransUnion’s financial services business unit, interprets it:
This was an especially enlightening part of the study, because we found that home price appreciation and depreciation can impact mortgage and credit card payment patterns quite differently, depending on whether consumers consider the environment ‘normal’. While we saw massive home value appreciation between 2003 and 2006, the spread between credit card delinquency and mortgage delinquency remained effectively the same; that is, the home value appreciation, while big, was expected and therefore not a driver of change. However, once home values experienced major declines in 2007 and 2008, the delinquency spread narrowed to the point where more people were opting to pay their credit cards before their mortgages — something that was unimaginable just a few years prior.
Well, I, for my part, have a different reading of the data. When home prices are rising, so is your net worth. So, whether or not you consider the environment “normal”, it is very much in your best interest to stay current on your mortgage. Things change rather dramatically, however, when home prices are falling fast, as they did in the post-Lehman world. In the most extreme (but far from uncommon) example, once your house is worth less than you paid for it, it becomes very much a liability, not an asset. Yes, in the long run it may rebound sufficiently, but in the long run… As a consequence, a higher-than-usual proportion of home owners become delinquent on their mortgages.
A City-by-City Comparison
TransUnion’s study found great variances in the way the major U.S. home markets experienced the housing bubble. For example, the researchers tell us, Los Angeles, Chicago and Dallas experienced markedly different dynamics, which resulted in different payment hierarchy experiences. While the delinquency spread between mortgage and credit cards for the United States as a whole peaked at slightly over 1 percent, the hardest-hit markets had much higher spreads.
In the case of Los Angeles, which experienced significant home value depreciation followed by a period of stable prices and a recent period of home price appreciation, the credit card-mortgage delinquency spread “flipped” in December 2007 — more consumers were going delinquent on their mortgages than on their credit cards. The delinquency spread between mortgages and credit cards peaked early on at above 4 percent. However, the spread declined continuously until reaching near-parity levels by the end of 2012. Now we are told that, at the end of 2013, the spread was zero.
In contrast, Dallas, which was mostly insulated from the housing crisis, had stable price conditions. As a result, its delinquency spread experienced little change over the examined period, starting and ending below zero and moving within a narrow band. The reversal in payment patterns occurred much later — beginning in June 2011 — and lasted only through September 2012.
Here is how six major markets fared the crisis:
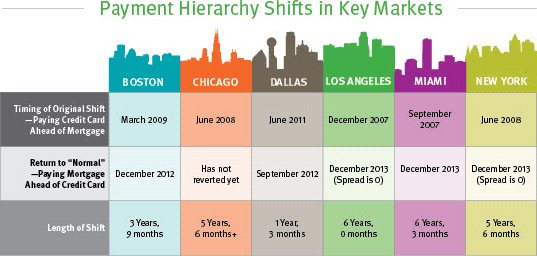
Here is what TransUnion’s Becker interprets the data:
It’s been well documented that the Great Recession impacted different areas of the country to varying degrees. While unemployment generally went up throughout most of the country, some areas saw more job losses than others. Markets that experienced extreme housing value increases and declines also saw the biggest shifts in payment dynamics. As unemployment gradually improves and housing prices recover, we expect every major metropolitan city will revert to the traditional payment hierarchy.
Well, of course, things will get back to normal, eventually. But looking at the table, I am once again reminded that the numbers for my home market of Boston are much closer to the ones for Dallas than they are to L.A. or even Chicago, which, at first sight, is quite amazing. However, while Boston did go through a period of a huge home price appreciation, as L.A. did, the drop in the market’s Home Price Index (HPI) (not shown here) is the lowest among the examined markets, lower even than Dallas’, which had experienced almost no bubble at all. And yes, it is true that Boston’s home prices never quite looked like they were collapsing, far from it.
The Takeaway
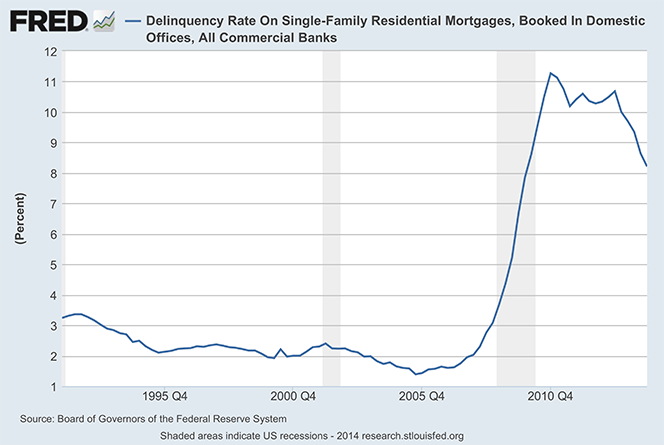
There is another way to illustrate the shifts in Americans’ debt repayment priorities. The fact is that both mortgage and credit card delinquency rates have now fallen well below their post-crisis peaks. Yet, whereas credit card delinquencies are now at a record-low level, mortgage delinquencies are still quite high by historical standards. The two graphs below drive the point home (source). First, mortgages:
And here is the credit card delinquency graph:
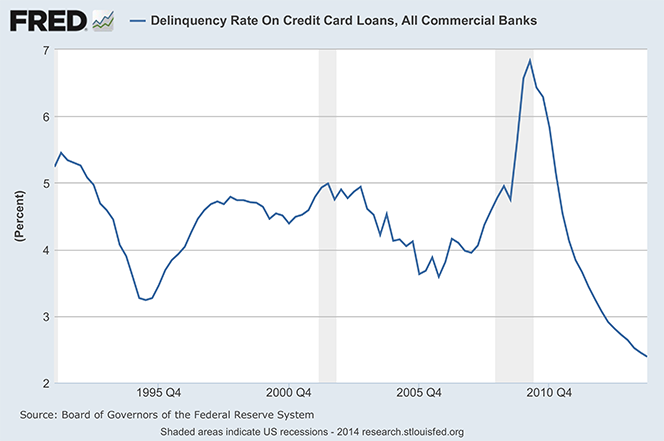
Of course, the graphs above include data for all consumers, not just the Americans who have all three types of credit loans outstanding. Still, it is quite clear that, even though much progress has been made, mortgage delinquencies still have a long way to fall before they catch up with credit cards.
Image credit: Wikimedia Commons.


