Americans Get More Credit Cards, Pay on Time and Keep Balances Low

That is the essense of TransUnion’s analysis of how Americans were managing credit in the second quarter of this year. Having grown substantially in 2011 and in Q1 2012, new credit card originations increased again in Q2 2012, albeit at a slower rate. The share of new cards going to consumers with less-than-stellar credit score slightly decreased on a yearly basis, but it is still much higher than the level measured two years ago.
The delinquency rate fell again and is now near its all-time low level, even as the average borrower’s indebtedness to credit cards nudged upward on a quarterly basis, we learn. Moreover, rather than being confined to certain areas of the country, the continual fall in the late payments rate is a nationwide phenomenon. Let’s take a closer look at the numbers.
Americans Got 4% More Credit Cards in Q2 2012
The number of credit card accounts opened in Q2 2012 was higher by 4 percent than the corresponding one for Q2 2011, TransUnion tells us. The share of consumers with a VantageScore (a credit score alternative to FICO that is maintained by the three national credit bureaus and is ranging from 501 – 990) below 700 who received new cards was measured at 26.1 percent, down from the 27.0 percent ratio recorded in Q2 2011, but up from the 24.1 percent figure reported in Q1 2012 and much higher than the 20.6 percent share in Q2 2010.
The good news is that, even as U.S. card issuers have been lending more freely to these higher-risk borrowers, that has not resulted in a higher credit card delinquency rate. On the contrary, the late payments rate has remained virtually unchanged from the previous year’s level.
Credit Card Delinquency Rate at 0.63%
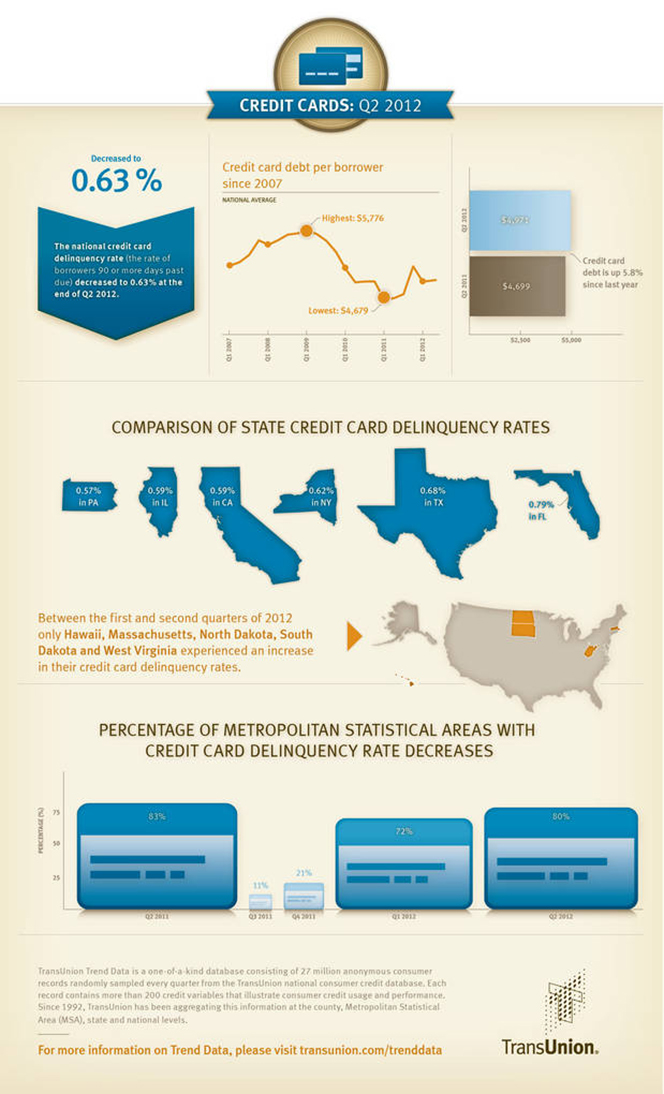
TransUnion reports that the U.S. credit card delinquency rate stood at 0.63 percent in Q2 2012, slightly up from the 0.60 percent level recorded in the same period last year, but down from the previous quarter’s 0.73 percent. It is well below the historical averages, we learn.
TransUnion’s quarterly delinquency reports are in some ways more valuable than the data we get from the card issuers’ monthly regulatory filings, because the credit agency’s data provide a more comprehensive picture of Americans’ debt repayment behavior. While the issuers measure their delinquency ratios on a per-account basis, rather than per consumer, TransUnion calculates it as the share of consumers who are late on a payment to any one of their credit cards. Furthermore, the credit bureau defines an account as delinquent if a payment is 90 days or more past due, whereas the issuers use two shorter time periods: early-stage delinquencies for payments late by 30 – 59 days and late-stage delinquencies for payments past due by 60 days or more. So TransUnion’s delinquency rate falls somewhere between the issuers’ delinquency and charge-off rates (accounts are typically charged off as losses at 180 days after the last payment on the account).
Mississippi Has the Highest Delinquency Rate, North Dakota — the Lowest
In Q2 2012, only five states saw an increase in their delinquency rates. Listed below are the states leading both ends of TransUnion’s table of credit card delinquencies:
1. Mississippi — 0.97%.
2. Nevada — 0.89%.
3. Alabama — 0.84%.
4. Georgia and West Virginia — 0.82%.
…
47. Nebraska — 0.44%.
48. Montana — 0.43%.
49. South Dakota — 0.42%.
50. North Dakota — 0.36%.
The biggest year-over-year delinquency decline was measured in Montana — 10.42 percent — and the largest increase — in Massachusetts — 39.22 percent.
Credit Card Debt Slightly Up
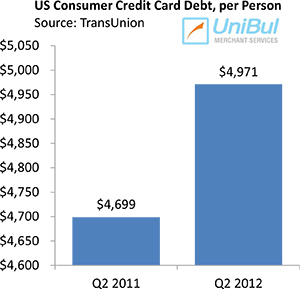
 The average amount of credit card debt per borrower in Q2 2012 — $4,971 — was virtually unchanged on a quarterly basis and was only 5.79 percent above the level measured in Q2 2011 — $4,699.
Here is the list of the leading states by average credit card debt per borrower on both ends of TransUnion’s quarterly table:
1. Alaska — $7,045.
2. Colorado — $5,728.
3. North Carolina — $5,619.
4. Connecticut — $5,532.
…
47. South Dakota — $4,257.
48. Wisconsin?á– $4,252.
49. North Dakota?á– $4,006.
50. Iowa — $3,874.
The biggest year-over-year decline in credit card debt was recorded in Mississippi — 5.34 percent — and the biggest increase — in the District of Columbia — 15.01 percent.
The Takeaway
So the aggregate delinquency rate is virtually at an all-time low and there are no signs as of yet that the trend has run its course (the three largest U.S. banks reported a 0.92 percent fall in Q2 2012 delinquencies). And for as long as the late payments rate remains that low, any rise in the level of indebtedness should not be of concern. But even with the annual increase reported by TransUnion, that level is still very low by historical standards.
TransUnion’s report mirrors the latest Federal Reserve Consumer Credit release, from which we learned that the aggregate amount of credit card debt at the end of the second quarter of 2012, while slightly above the Q2 2011 level, was still lower by 14.4 percent, or $145.7 billion, than the $1,010.3 billion figure measured at the end of 2008 and was actually just below the $864.9 billion mark set at the end of 2011. So Americans are still very reluctant to take on more credit card debt and whatever amount they do take on is paid back on time.
Here are TransUnion’s findings presented in an infographic:

Image credit: Girlsguideto.com.


