On Rising Inequality, Household Borrowing and the Financial Crisis

The “keeping-up-with-the-Joneses” hypothesis of dramatically rising household debt in the build-up to the financial crisis of 2008 is wrong, conclude four economists in a new paper for the Federal Reserve Bank of Richmond. The authors — Olivier Coibion, Yuriy Gorodnichenko, Marianna Kudlyak and John Mondragon — have looked into household level data on debt accumulation for the period 2001 – 2012 and seen that low-income households in high-inequality regions accumulated less debt relative to their income than their counterparts in lower-inequality regions, which, they say, negates the hypothesis.
Instead, the economists argue that the observed debt accumulation patterns are consistent with supply-side interpretations. The authors then go on to offer a model, in which lenders use applicants’ incomes, combined with local income inequality, to determine the “underlying type of the applicant”, so that the banks end up channeling more credit toward lower-income applicants in low-inequality regions than they do in high-inequality ones. The economists claim that the data confirm the predictions of their model.
This all makes perfect sense to me, but I was a bit surprised that the authors have neglected to even mention what seems to me to provide the most obvious confirmation of their conclusions. The Silicon Valley is as unequal a place as you will find in the U.S. and this inequality is reflected in the area’s home prices. For people at the lower ranges of the income distribution scale, relative to income, housing is incomparably more expensive in the Silicon Valley than it is in cheaper places like, say, Alabama, and this divergence was becoming progressively more acute as the build-up to the Lehman event was gathering momentum. It seems plain to me that, even in such abnormal times, lenders would have felt much more comfortable extending credit to borrowers who would have been vastly more likely to repay it. And these borrowers happened to live in less unequal places. Now let’s take a look at the paper.
Debt Accumulation and Supply vs. Demand
The exceptional rise in U.S. household borrowing, which preceded the 2008 financial crisis, was caused primarily by a rise in mortgage debt and there are two main views about the process that led to it, the authors remind us. The first view is that the rise in borrowing reflected credit supply factors. Progress in information technology and rising “financialization” of debt (especially mortgages) caused an increase in the supply of credit to households in general and disproportionately so to low-income and high-risk households. Political motivations may also have contributed: in response to rising income inequality and in the face of stagnant incomes, credit was made increasingly available to lower income groups to support their consumption levels.
The second view identifies a rising “demand for credit” on the part of U.S. households in general, but especially to low-income households. Rising inequality is once again singled out as a motivational factor for such a rise in demand for borrowing:
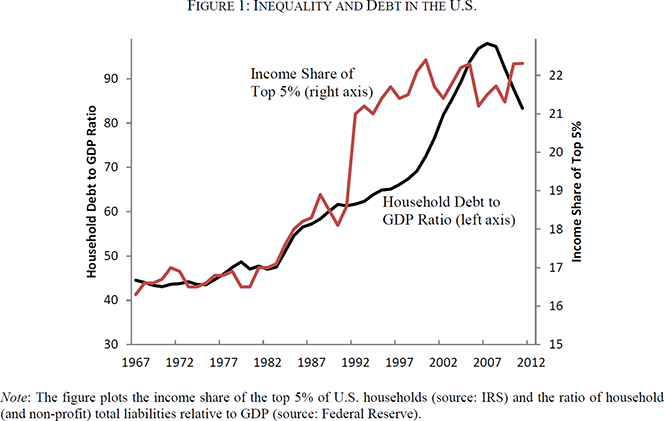
Specifically, rising consumption on the part of wealthy households could have generated a rise in the demand for borrowing on the part of lower-income households in their attempts to “keep up” with their wealthier neighbors, the so-called “keeping up with the Joneses” effect. Indeed, there is a positive correlation between income inequality in the U.S. (income share of the top 5%) and household debt relative to GDP (Figure 1) over time. Both were stable from 1967 to around 1980, then both measures rose gradually over the course of the 1980s as noted in Iacoviello (2008). But while income inequality then went up sharply in the early 1990s, household debt only caught up over the 2000s. The correlation is certainly consistent with the possibility of a causal relationship running from inequality to household borrowing.
Here is the graph:

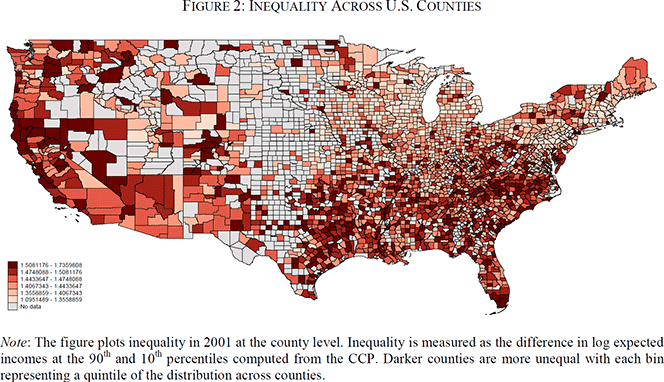
And here is an inequality map of the U.S.:

The Richer Got More Indebted than the Poorer
In exploring these two alternative explanations, the researchers believe to have found the answer:
Our main finding is that high-income households in high-inequality regions accumulated more debt relative to their incomes than did low-income households in the same regions, or equivalently that low-income households in high-inequality regions borrowed relatively less than similar households in low-inequality regions. This effect is precisely the opposite of what one would have expected from “keeping up with the Joneses” driving the rise in household debt during the 2000s.
But is it? Isn’t it equally possible that a larger share of low-income households were excluded from the credit market in higher-inequality regions than in lower-inequality ones. After all, even at times as crazy as the pre-Lehman period, the ability to repay a loan counts for something. If that were the case, these excluded households would have been prevented from even trying to keep up with the Joneses. So, in higher-inequality regions, the only households who would have had the opportunity to overleverage would have been the higher-income ones. And yes, they took full advantage of it.
But then the authors tell us this:
We find strong evidence that low-income households in high-inequality regions borrowed less in terms of both mortgage and auto debt than those in low-inequality regions. A unique feature of the data is that we have information on both credit card balances as well as credit card limits. This is particularly useful because the latter can be interpreted as largely representing credit supply whereas the former primarily reflects the demand for credit. We find that low-income households in high-inequality regions saw their credit limits rise by less than those in lower inequality regions as was the case with mortgage and auto debt. At the same time, no economically significant heterogeneity is observed in terms of credit card balances. We interpret this contrast as pointing to supply side factors as being at the root of the differential debt accumulation patterns that we observe in the data.
I think that the reason credit limits for lower-income households were found to be lower in higher-inequality regions is that life is much more expensive in such places and the discretionary income of people at the lower ends of the distribution table, which is used by lenders in their underwriting decisions, is lower. In turn, this easier access to credit for low-income households in low-inequality regions has allowed them to accumulate more debt during the mid-2000s than did their counterparts in high-inequality regions.
So, again, the authors’ conclusion that supply-side factors are dominant in explaining the difference in debt accumulation sounds quite plausible to me.
The Takeaway
So where does all that leave us? Well, the authors argue that the continuation of the trend toward rising inequality will further reduce the supply of credit to lower-income households. In turn, they continue, limited access to credit would restrict these households’ ability to “smooth their consumption and to engage in long-term investments (e.g. sending children to college, retraining for different careers)” and that could ultimately have negative longer term consequences. Then they end up making the mandatory observation that “such a development could have important policy implications”. One would certainly think so.
Image credit: Wikimedia Commons.


