Did Our Grandparents Have It Easier?

That was the question I was asking myself as I was going over an infographic a correspondent had sent to me last week. The graph in question was dealing with a favorite subject of ours here at UniBul — college student debt — but the author had taken a look further back in time than we usually do when writing on the topic and had given us some data I hadn’t seen before. The author had even anticipated my question and taken a crack at it toward the end of the graph: almost 2 million Americans over 60 are paying off their student loans — do you still think they had it easier?
Well, of course I was being facetious and such a question is meaningless anyway, but we can still play with the data, right? At any rate, that’s what the infographic is doing and is coming up with some interesting statistics in the process. We learn, for example, that in 1940, the average undergraduate tuition at Yale was $7,200 in today’s dollars ($450 in 1940 dollars). For comparison, Yale’s tuition fee for the academic year 2013 – 2014 is $43,100 — six times as big. So I guess, if nothing else, one may just be allowed to feel some envy for the low cost of college education in years past. But you’ll decide for yourself.
Why Student Debt Is a Problem
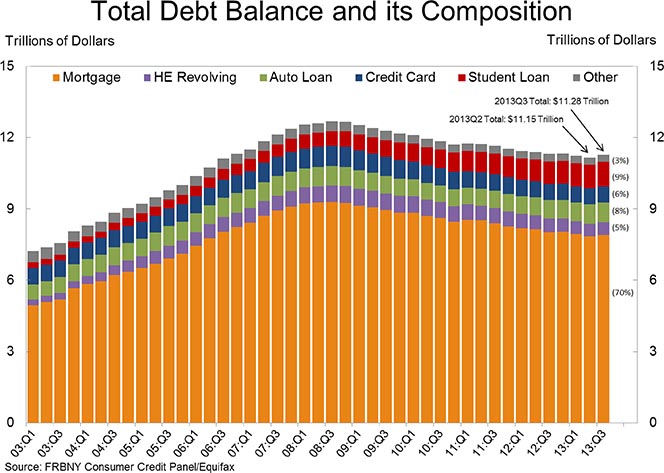
Before I get to the infographic in question, though, let’s take a look at how each component of the U.S. household debt has fared over the past decade (source). The chart below shows you the distribution of U.S. consumer debt among its six constituent parts. As you can see, five of these components have either fallen from their pre-Lehman peaks or have remained fairly flat. The sole exception is student debt, whose total — $1,027 billion in 2013 Q3 — is up by 68 percent from the $611 billion level of Q3 2008.

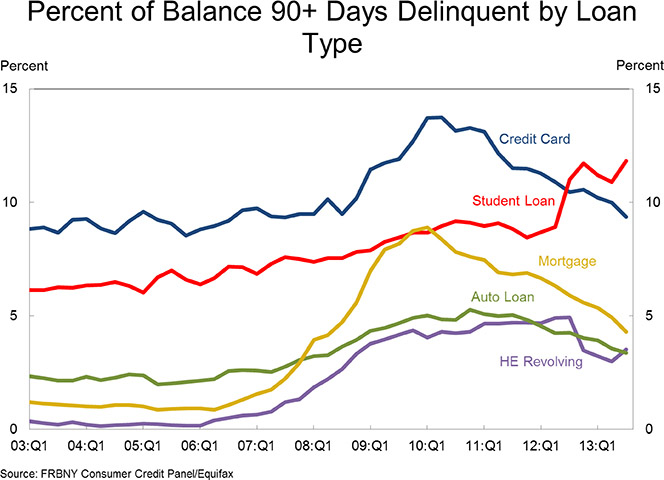
Now take a look at the chart below. It shows you that the delinquency rates of the same five consumer loan types have fallen since reaching their post-Lehman peaks. The only exception, once again, is student debt, whose delinquency rate continues its relentless rise.

Did Someone Have It Easier?
And now here is the promised infographic, along with the introduction provided by one of the authors.
So you’re thinking about going back to school to breathe new life into your career. Perhaps you think you need a higher degree to get to the next step in management. Or you can’t stand continuing on the same path that you once thought was something you wanted to do for the rest of your life and need a fresh start. In fact, you’d be like the thousands of professionals who are returning to school in this less than favorable job market. However, before you jump on the shiny new degree bandwagon, ask yourself if the additional debt is worth the leap. With the rising costs of education, it’s unlikely that you will be able to pay tuition up front, so a student loan will be necessary.
Consider that an undergraduate degree will leave the average student with $25,000 in debt after four years. A graduate degree is likely to be more than that. A prestigious or private school will be significantly more than average as the average private law school student graduates with at least $125,000 in debt. And once you graduate, those loans are due. Toss in less than ideal interest rates and the questionable state of the job market, and you may be in a worse situation than before you sought out more schooling. Take a moment to go over this infographic by Consolidated Credit as it illustrates how much interest you’ll actually end up paying on a loan and how long it can take for the average person to pay off this debt — and take this information into consideration before seeking out another degree. While education is expensive, it still can end up being a valuable investment as college degree holders still earn significantly more than those without a degree and the higher the degree you have the more your average earnings.

Image credit: Flickr / Saint Huck.

