6 Fascinating Black Friday Stats
Statistics from the biggest shopping weekend of the year have, customarily, been coming fast and furious all week long. As expected, many records have been broken, some have been completely shattered. Once again, the shopping extravaganza began early on Thanksgiving evening and lasted all the way through the late hours of Cyber Monday. One wonders whether one of these years Thanksgiving will earn its own place in the holiday shopping calendar — for now it is being lumped together with Black Friday, but that doesn’t seem fair.
Anyway, as usual, IBM has been tracking the holiday weekend’s online retail sales for us and is sharing the data. We learn, for example, that New York City tops the list for online sales on Black Friday, ahead of Atlanta, Los Angeles, Washington, D.C. and Chicago. Here are six fascinating stats from the company’s Black Friday report.
Black Friday 2013 by the Numbers
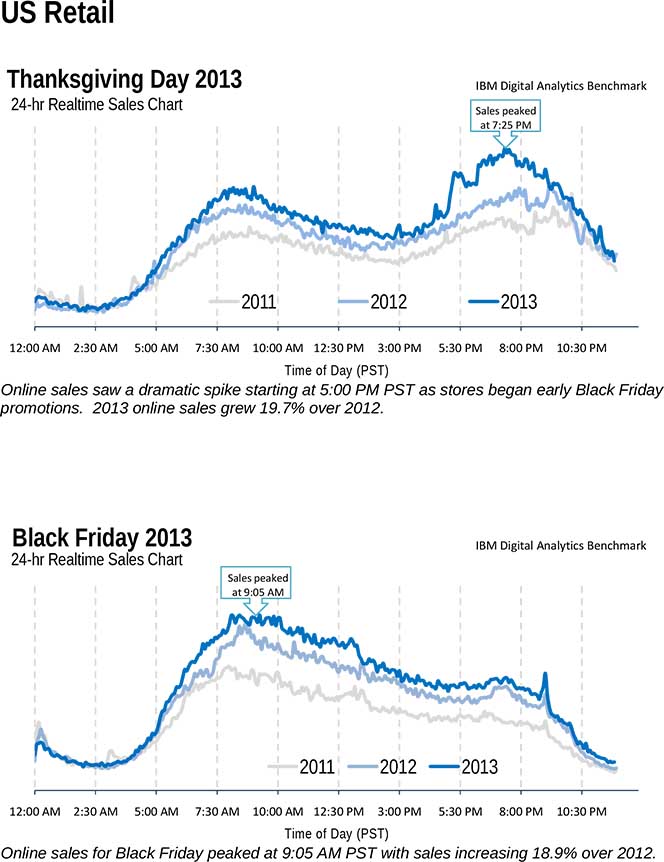
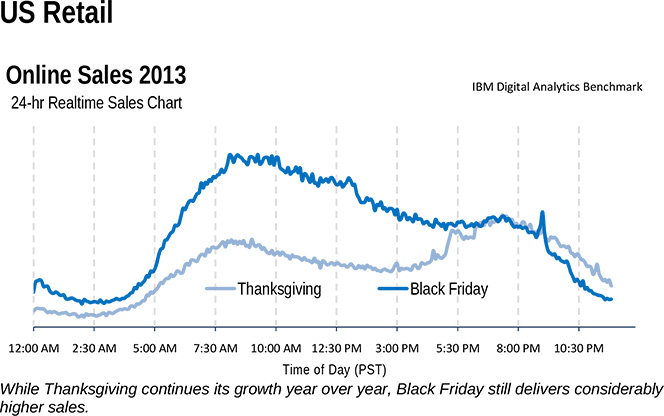
Thanksgiving Day and Black Friday both saw record online retail sales, driven in large part by strong growth in mobile shopping, we learn. Online sales peaked at 7:25 PM PST on Thanksgiving Day and at 9:05 AM PST on Black Friday. Here is the full distribution:
And here are the Thanksgiving Day / Black Friday highlights:
1. Thanksgiving Day online sales grew by 19.7 percent year-over-year.
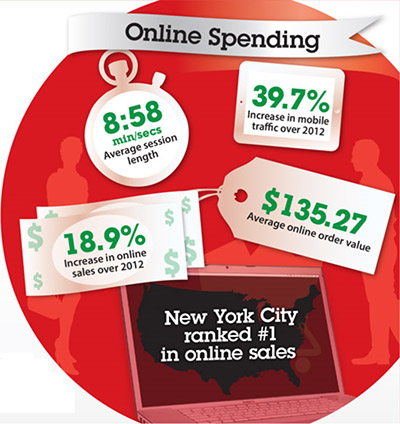
2. Black Friday online sales rose by 19 percent over 2012’s level. The average transaction amount was $135.27, up by 2.2 percent on an annual basis.
3. Mobile sales grew to 21.8 percent of the total online sales, an increase of close to 43 percent from last year. Mobile traffic also grew substantially, to 39.7 percent of all online traffic — 34 percent increase over Black Friday 2012.
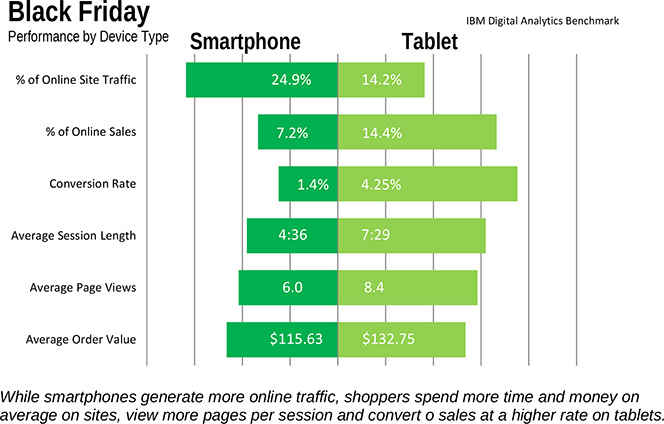
4. Smartphones browse, tablets buy. That is quite revealing: smartphones were responsible for 24.9 percent of all online traffic on Black Friday, compared to tablets’ 14.2 percent. However, tablets accounted for 14.4 percent of all online sales, precisely twice the share of smartphones (7.2 percent). Moreover, we learn, the average tablet transaction was 15 percent higher, in dollar terms, than the average smartphone one: $132.75 versus $115.63, as you can see below.
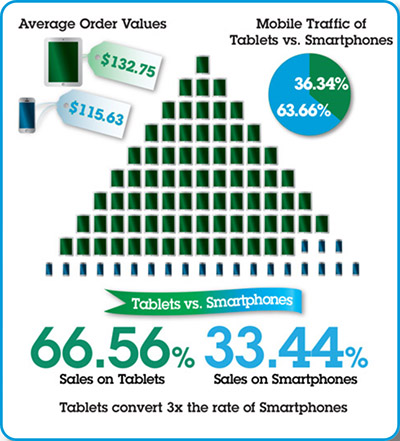
And here is a more detailed breakdown:
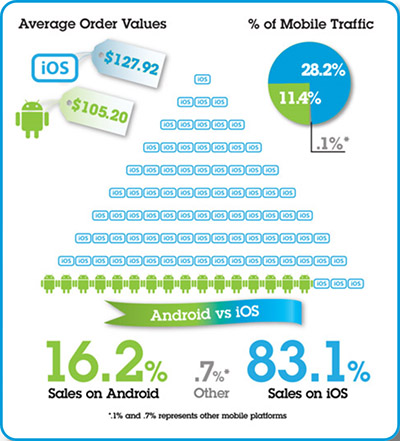
5. iOS thrashed Android. The average iOS user spent $127.92 per order on Black Friday, compared to $105.20 for her Android counterpart. Furthermore, iOS traffic made up 28.2 percent of all online traffic, about two-and-a-half times Android’s share of 11.4 percent. Oh, and one last thing: iOS sales comprised 18.1 percent of all online sales, compared to 3.5 percent for Android.
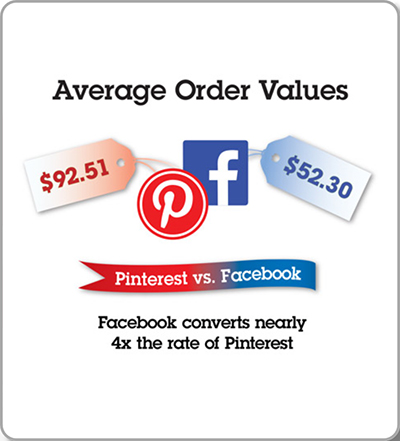
6. Pinterest vs. Facebook. Black Friday shoppers referred from Pinterest spent 77 percent more money, on a per-order basis, than those referred from Facebook. Moreover, Pinterest’s average order amount was $92.51, higher by 77 percent than Facebook’s average of $52.30. However, Facebook’s referrals converted into sales at nearly four times the rate of Pinterest. So there doesn’t seem to be a clear winner here.
The infographic below shows you how four of the top retail categories did this past Black Friday, compared to the previous one (data, again, from IBM).

Here you can play with a nice interactive infographic put together by the authors to illustrate their results.
Image credit: Wikimedia Commons.
