Who’s Who in the U.S. Credit Card Industry

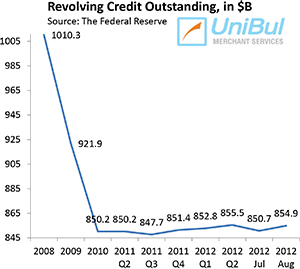
We have been following closely the credit card debt deleveraging trend that emerged in the U.S. in the aftermath of the financial crisis in September 2008. Lehman’s collapse initiated a big shift in Americans’ debt repayment preferences that is still ongoing. As the Nilson Report reminds me, at the end of last year, at $821.54 billion, the credit card debt total in the U.S. equaled 29.68 percent of total consumer credit, which was the lowest level of card debt in relation to total consumer credit since 1990, when it stood at 29.42 percent. The highest ratio of card debt to total consumer debt was recorded in 1997 when it was 40.95 percent. In relation to the total amount of household debt — $12.819 trillion — credit cards made up 6.41 percent of the total, down from a peak of 10.05 percent in 1996. On a per-household basis, at the end of 2012 the credit card debt average was $6,785, down from $6,878 in 2011.
So, as I said, the credit card debt deleveraging process has been very prominent in post-crisis America and is still continuing. That has all been well documented, both on this blog and elsewhere. However, we have neglected to cover how the biggest players in the U.S. credit card industry have fared since the Lehman collapse. Well, the Nilson Report happens to have produced several charts that help us do just that. Let’s take a look.
Credit Card Volume Is 53% of Total Card Volume
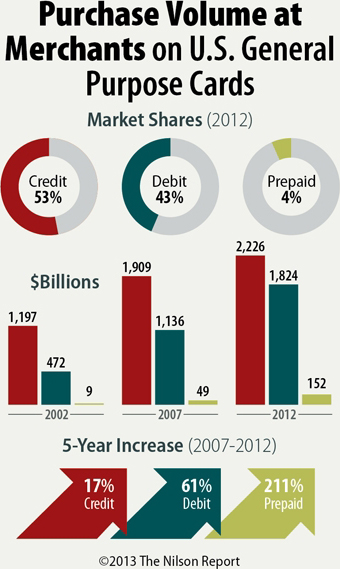
First, let’s see how the processing volumes of the three types of payment cards have evolved. The chart below breaks down Visa, MasterCard, American Express, Discover, and PIN-based EFT network spending among credit, debit, and prepaid cards for 2012 and gives us the 5-year change in their volumes for the period 2007 – 2012.

Visa Owns 55% of the U.S. Card Market
Visa is by far the biggest credit card brand in the U.S., owning more than half of the market. As the chart below shows, at the end of last year, more than a quarter of all U.S. payment cards — 26 percent — were Visa credit cards and an even greater share — 29.2 percent — were Visa debit cards. In contrast, MasterCard’s total share was 26 percent. We also see that no significant shifts have occurred since 2007.

First Data Is the Biggest Acquirer
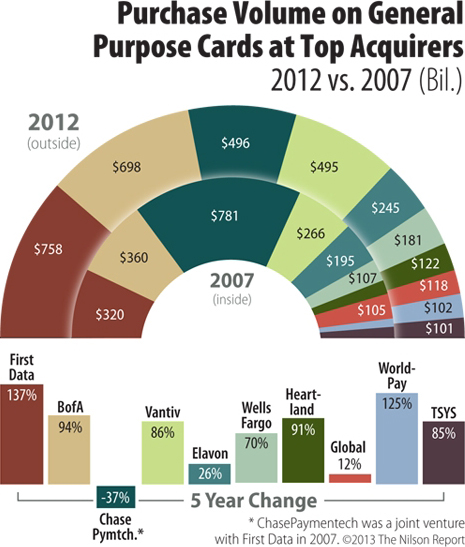
This is where the biggest shift has taken place over the past five years. Since 2007, and following its break-up with First Data, Chase Paymentech’s share of the purchase volume has plummeted by 37 percent, costing the acquirer the top spot. First Data has clearly benefitted from the dissolution of the old Paymentech, of which it was part owner, having grown its processing volume by 137 percent in the period. Bank of America’s volume has also grown quite substantially — by 94 percent. Overall, the 10 biggest U.S. merchant acquirers processed 64.61 billion transactions in 2012.

GE Is the Biggest Store Card Issuer
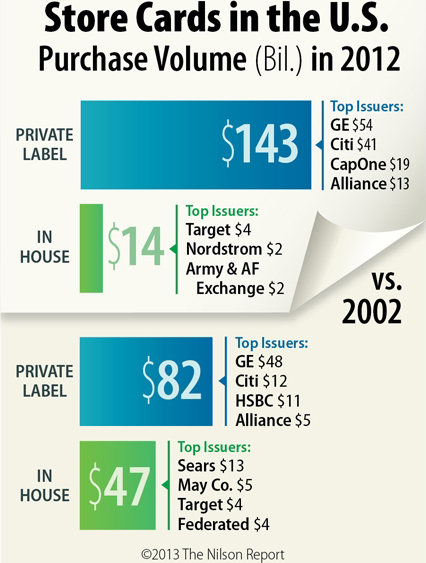
Store cards, as the Nilson Report reminds us, are owned either by retailers directly or by third-party issuers. The trend over the past 10 years has been for more retailers to choose third parties to issue their cards and by far the biggest beneficiary from that trend has been Citi, whose store card purchase volume has more than tripled for the period — from $12 billion to $41 billion. Yet, as the chart below shows, at $54 billion, the biggest third-party issuer by volume is still GE.

China UnionPay Has Become the Biggest Global Card Issuer
Finally, even as we are keeping our focus on the U.S. market, we shouldn’t neglect the global trends and there is nothing bigger right now than the rise to global dominance of China UnionPay — the state-supported Chinese credit card association, which is the only one allowed to process yuan-denominated transactions. By 2011, UnionPay had issued 2.95 billion cards, compared to 2.35 billion for Visa, up from 1.3 billion and 1.71, respectively, in 2006. By 2016, the Nilson Report expects UnionPay to have issued 4.66 billion cards, way ahead of Visa’s total of 3.05 billion.

The Takeaway
The Nilson Report’s data show us that, even as Americans have become increasingly unwilling to carry credit card debt in the post crisis years, and even as unemployment has been stubbornly high and incomes are still depressed, both the number of cards issued and the volumes processed by the biggest acquirers have been steadily rising.
Image credit: Flickr / Philip Taylor PT.


