What Americans Are Doing with Their Credit Cards Is Simply Extraordinary. Chart #2 Says It All.

Americans are now using their credit cards much more for their transactional convenience than as a form of debt, the latest Credit Card Market Monitor report from the American Bankers Association tells us. To put it another way, we see credit cards today more as a plastic form of cash than we see them as a source of credit to be tapped now and repaid sometime in the future, if and when we can get around to it.
To be more precise, and as we will see in the charts that follow, the report’s data for this year’s first quarter show that, even as the monthly credit card purchase volumes have increased, the average ending balances have fallen by close to 5 percent. And as we have been paying back an ever larger share of our credit card debt for several years now, our credit card delinquency and default rates have consequently fallen to their lowest levels on record.
But here is the thing. Even though all the data have been telling an unambiguous story of Americans managing credit card debt a great deal more responsibly than we have done in a very long time, card issuers still don’t seem to trust us. For while the super-prime borrowers’ credit limits keep rising, those of everyone else are still falling. And it’s not as though only the super-prime accounts’ delinquency and default rates have vastly improved over the past few years — that has been true across all risk categories.
Perhaps the issuers are seeing in the data something I don’t? Or perhaps they are expecting Americans to revert to their free spending habits of old any day now? Well, I can’t read the card issuers’ collective minds and I certainly cannot divine what Americans’ attitude toward credit card debt will be, say, one year from now. What I can say, however, is that there is absolutely no clue that I can see in the data pointing toward a return to some kind of a wastefully extravagant pattern of credit card use anytime soon. But don’t take my word for it, here are the latest data.
Credit Card Limits, Balances, Cost of Credit Keep Falling
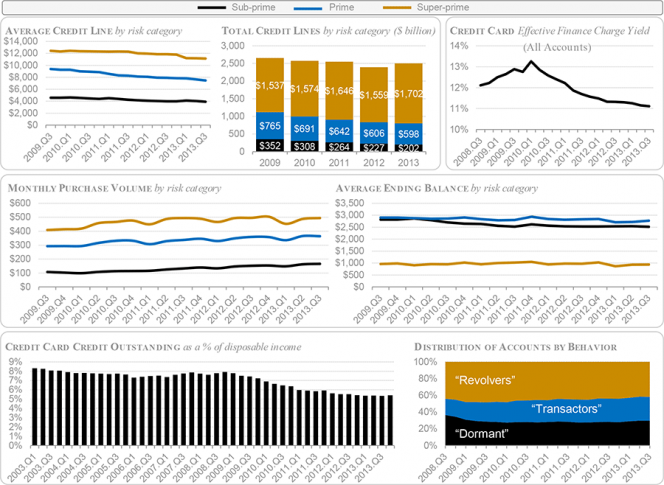
Up until the previous quarter, the average line of credit was falling across all risk categories. Well, this time is different and the average credit lines have actually increased by 4.6 percent year-over-year, although the rise was entirely due to rising credit availability for super-prime accounts.
Credit lines for prime and sub-prime accounts, in stark contrast, continued to fall. As a result of this long-lasting and still ongoing fall, prime and sub-prime accounts now represent their smallest share of total credit lines in the last six years — down from 42 percent in 2008 to 32 percent in 2013.
Yet, even as credit continues to be scarce for a large part of the borrowing public, its cost to cardholders nevertheless also keeps falling, as illustrated in the chart below. As a share of their outstanding credit card balances, consumers are now paying less in interest charges than we have done since well before the financial meltdown of September 2008.
The ABA measures the cost of credit using the Effective Finance Charge Yield (EFCY), which is the interest charged to accounts, calculated as a share of outstanding credit balances. The EFCY has now fallen for 13 consecutive quarters, we learn, from 12.65 percent in the first quarter of 2008 to a smidgen above 11 percent at the end of 2013 Q3. This ongoing decrease in the EFCY can be attributed to changing consumer and industry behavior, which is plainly illustrated in the data:
- Monthly purchase volumes are generally rising across categories, but the average ending balances are falling. This pattern, we are told, is consistent with a historically high share of consumers categorized as “transactors” — cardholders who pay off their monthly balances in full.
- The health of credit card portfolios keeps improving. The average credit score of a sub-prime account holder is rising faster than other risk categories. Moreover, the credit card delinquency rate has dropped to 2.39 percent — the lowest point since the Federal Reserve started publishing such data in the first quarter of 1991.
- Credit card debt, as a share of disposable income, stood at 5.4 percent in 2013 Q3 — close to the lowest level in more than a decade.
The ABA researchers read the data as illustrating that “at least for now… consumers are using credit cards more as a transactional tool to pay for goods and services and not as a form of debt”. Here are the charts, which illustrate their findings (click on the image below for a better view):
Consumer Spending Rises Across Categories
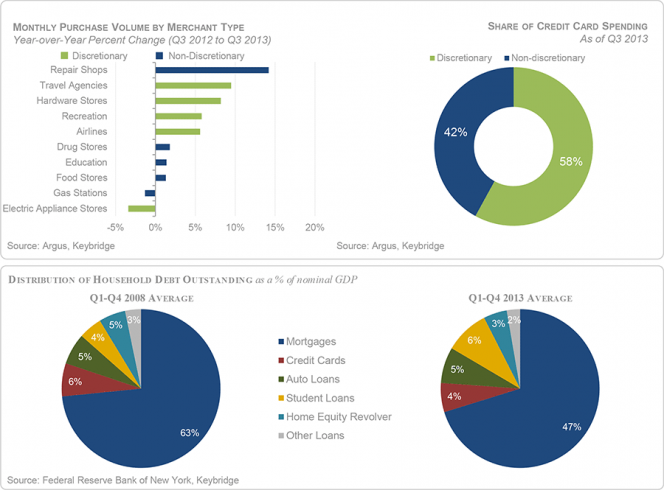
As already noted, people with credit cards have been using them ever more freely, with spending on discretionary goods and services increasing the fastest, although non-discretionary spending is also rising. Here are the latest data:
- Average monthly purchase volume on all credit cards has increased by 3.4 percent from 2012 Q3 to 2013 Q3. Spending at “discretionary” merchants rose by 3.5 percent, while spending at their “non-discretionary” counterparts grew more modestly — by 1.4 percent. However, the fastest growth rate was measured at non-categorized merchants — 5.4 percent.
- To give a few examples (one for each category), spending at travel agencies (discretionary) increased by 9.5 percent, spending at drug stores (non-discretionary) rose by 1.8 percent and spending on mail orders (non-categorized) spiked by 18.3 percent.
- The majority of credit card spending falls into the “discretionary” category. About 60 percent of all credit card spending in 2013 Q3 took place at merchants more likely to be selling discretionary goods and services.
- Over the past year, spending on rewards cards has increased by 7.8 percent. Unsurprisingly, rising rewards card spending was led by gains in super-prime accounts (up by 12.5 percent on an annual basis), as these cards are most likely to have a rewards program in the first place. Yet, spending in this category was also recorded among sub-prime accounts (up by 6.8 percent annually) and prime accounts (up by 5.3 percent).
- In 2013 Q4, household debt rose by 2.1 percent ($241 billion) to a six-year high of $11.5 trillion. Yet, household debt levels still remain about 9 percent below their pre-Lehman peak. The increase in household debt was driven by a $152 billion rise in residential mortgages. Furthermore, from 2013 Q3 to Q4, the student debt total increased by 5.2 percent, while outstanding credit card balances rose by only 1.6 percent.
Here are the charts visualizing these data (click on the image below for a better view):
The Takeaway
Here is how Kenneth J. Clayton, executive director of ABA’s Card Policy Council, interprets his report’s findings:
We’re seeing a more confident consumer who is willing to spend more money on non-essentials because they’re less concerned with the direction of the economy and their ability to keep debt at manageable levels. Whether this trend will continue remains to be seen.
I agree, but the question that keeps bugging me is why there has been such a marked shift among card issuers toward super-prime borrowers. I guess that made sense in the crazy immediate aftermath of Lehman’s collapse when delinquencies and charge-offs went sky-high, but that was years ago. All the available data keep telling us that Americans are now managing credit card debt more responsibly than they have done in a very, very long time, if not ever — both delinquencies and defaults are now at historical lows and consumers are repaying debt faster than ever before.
I think it’s inevitable that eventually the issuers will wake up to the new reality, but it’s amazing that it’s taking them quite that long.
Image credit: Europol.


