This Is a Great Time to Be a Credit Card Company in America
This is the inescapable conclusion from Fitch Ratings’ latest analysis (registration required) of the performance of the seven biggest U.S. credit card issuers in the third quarter. Low as they already were, the issuers’ charge-off and delinquency rates improved even further in the period, we are reminded. Yet, even as cardholders kept their resolve not to fall behind on their payments, they nevertheless continued to increase their credit card spending at a healthy pace, which Fitch explains with a desire to optimize card reward benefits.
Well, that trend of continually falling charge-offs and delinquencies and rising spending volumes is nothing new, of course. In fact, it has been ongoing since 2010, defying many a prediction about its imminent end along the way. Now Fitch Ratings makes another forecast, vague as it may be. Noting the record-low levels that have now been reached, and observing that charge-offs and delinquencies cannot actually hit zero, the ratings agency expects “some modest deterioration in 2014”. For my part, I’m not quite sure about that and believe that there may still be room for some further improvements. It seems to me that, if spending volumes continue to grow at their present rate, and there is a good reason to expect that they will as the economy keeps improving, it would take a noticeable shift in consumer attitude toward higher debt tolerance to send delinquencies and charge-offs higher and I just don’t see any signs of such a shift. But let’s take a look at the data.
Purchase Volumes vs. Outstanding Revolving Credit
To illustrate my point, let me compare the growth of the credit card purchase volumes with the one of the revolving credit (made up almost exclusively of outstanding credit card balances). On the one hand, Fitch tells us that, for the top seven card issuers, purchase volumes were up by 7.2 percent in the third quarter of 2013, on average, compared to an average growth of 5.0 percent a year ago.
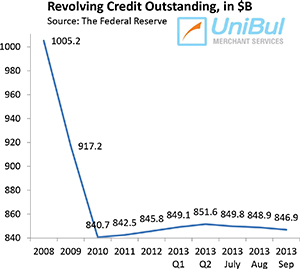 At the same time, as you can see in the chart to the right, the total outstanding revolving credit has remained virtually flat in that period — up by only 0.2 percent between 2012 Q3 and 2013 Q3. Furthermore, that total has remained largely unchanged since the middle of 2010 and is still lower by 15.7 percent than the peak of just over $1 trillion reached at the end of 2008.
So it’s really quite simple: for as long as credit card spending continues to grow at its present pace and outstanding revolving credit remains flat or grows slowly enough, neither the charge-off rate nor the delinquency rate can increase. After all, before you can have a delinquent account, never mind one that is charged-off, you need to have some unpaid balance on it to be carried over from one month to the next.
How the Charge-off Rate Correlates to Unemployment Indicators
This is interesting: it turns out that the prime charge-off rate (calculated using data from accounts having FICO scores of 660 or more) is very strongly correlated with unemployment insurance weekly claims and is not closely linked to the overall unemployment rate. Here are the charts:
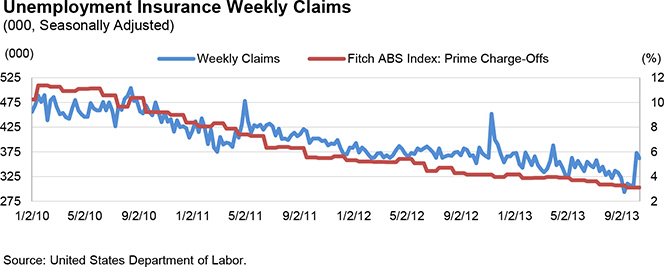
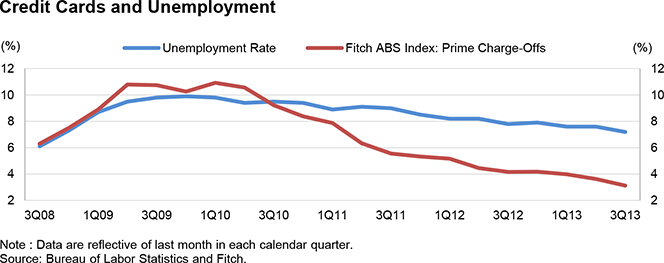
At the end of September 2013, prime charge-offs were at 3.12 percent — 1.04 percent below the level measured in September 2012, 8.40 percent below the peak of 11.52 percent, recorded in September 2009 and 3.21 percent below the 10-year monthly average of 6.33 percent.
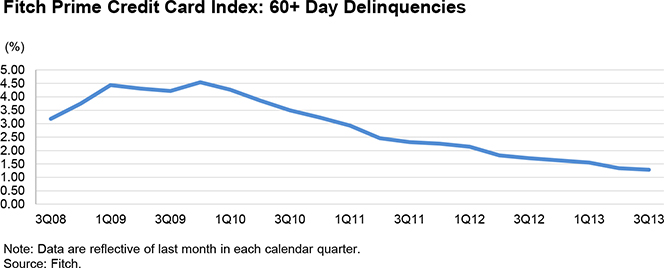
The late payments trend is very similar. Prime credit card delinquencies of 60 days or more stood at 1.28 percent at the end of 2013 Q3 — 0.43 percent below the level recorded in 2012 Q3, 3.26 percent below the peak delinquency rate of 4.54 percent measured in November and December 2009 and 1.56 percent under the 10-year monthly index average of 2.84 percent.
The Takeaway
Fitch reminds us that, in September 2013, the personal savings rate in the U.S. was 4.9 percent, according to the Bureau of Economic Analysis. That was 0.30 percent higher than the 10-year monthly average and 1.60 percent above the average from 2005 to 2007, the years preceding the financial crisis. The highest level over the last 10 years — 8.7 percent — was recorded in December 2012 and that was also the highest savings rate since December 1992, when the rate hit 9.9 percent.
Moreover, consumer leverage, as estimated by the financial obligations ratio (FOR), which measures debt service payments on mortgage debt, auto debt, consumer debt and property taxes as a percent of disposable personal income, was 15.34 percent in 2013 Q3. This compares quite favorably to the peak of 18.38 percent recorded in 2007 Q4 and a 33-and-a-half-year average of 16.75 percent, Fitch tells us.
Given all that, I wouldn’t be at all surprised to see further declines in both the delinquency and charge-off levels. Of course, they may have already reached bottom, but I just don’t see it in the data.
Image credit: Flickr / Josh Kenzer.

