On Infographics, Holiday Shopping and Credit Scores

Recently I had some fun with an otherwise beautiful and well-researched infographic, which its authors had evidently spent quite a lot of time working on, but had nevertheless managed to badly mangle — to the point of making it useless for the intended purposes. The really amazing thing about it was that the graph’s problem was painfully visible even to the most casual of observers. Or at least it should have been, as its creators had evidently seen nothing wrong with it.
Well, today I decided to publish a couple of infographics, neither of which is as strikingly beautiful as the one in question, yet in each case the authors have done a great job of getting their point across. Now, it is my firm belief that you can never, ever make a piece of marketing material that is too pleasing to the eyes, yet visual qualities won’t matter a bit if you get your presentation all wrong. One of the graphs is tracking the latest holiday shopping trends and projections for us, in anticipation of the upcoming Black Friday and Cyber Monday, and the other is visualizing some of the latest credit score data. Let’s take a look at both of them.
Tracking the Holiday Shopping Trends
The good guys at Mint.com and Motif Investing have partnered to review the latest holiday shopping trends, make forecasts about the upcoming one and present their data and predictions in an infographic. And, by the way, even though I know very well that the holiday shopping season is a make-or-break time for our retailers, I am still amazed every time I see the numbers. Here are some of them:
- Holiday shopping has made up 18.3 percent of all retail sales, on average, over the past few years.
- Holiday retail sales have grown in volume from $644.3 billion in 2010 to $709.6 billion in 2012 — an increase of 9.2 percent — and are projected to grow to $738 billion this year.
- Growth has been especially fast-paced in e-commerce, which has seen sales volume increase at a steady rate of just over 16 percent in each of the last three years. By comparison, offline retail sales volumes have grown at an annual rate of 5.3 percent, 7.3 percent and 4.5 percent in that period.
- Mobile commerce has accounted for $6.2 billion of holiday sales last year, up from $1 billion in 2010, and that volume is forecast to expand to $8.4 billion this season. As a share of total online sales, m-commerce has grown from only 3 percent in 2010 to 13 percent in 2012 and that number is expected to be 14.8 percent in 2013.
As usual, gift cards are the top item on Americans’ holiday shopping list, ahead of apparel, toys and electronics. Here is the graph:
![]()
Check Yourself before You Wreck Yourself
That is the admonishment we get from Quizzle in an infographic, which they sent to us recently. Now, the check-up in question has nothing to do with our physical health, but rather applies to our credit history. The authors have looked into recent reports on the latest trends in consumer credit scores in the U.S., some of which we have reviewed on this blog, and have done a nice job at picking the most interesting data from them.
For example, we are reminded that 65 percent of American adults (148 million people) have not reviewed their credit reports and 60 percent of us have not reviewed our credit scores. And that is quite an amazing stat, considering that, as the authors note, our credit scores determine whether or not we can get a loan of any type and, if we can, on what terms. Furthermore, checking your credit file, at least from time to time, can reveal any issues with one or more of your financial accounts you may be unaware of, as well as alert you to possible identity theft.
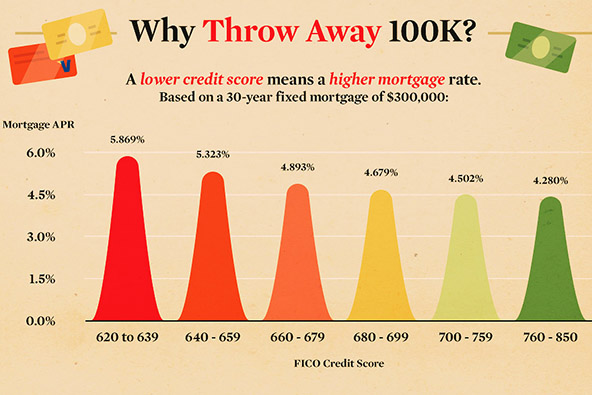
Then the authors proceed to calculate the difference between what a person with a low FICO score can expect to pay on a mortgage and what someone with a high FICO score would pay over the span of the loan repayment period. And, as you will see below, it is quite a striking number.
But what I found most noteworthy in the graph, and what should convince you to start checking your credit file regularly, if you aren’t doing so already, is the snippet informing us that 25 percent of Americans have found errors on their credit reports. As it happens, this blogger is one of them and can testify that the experience of cleaning up such an error is no fun at all. In fact, it took me about a month to remove the erroneous item from my credit files with each one of the three national bureaus. Yet, there is a procedure for how such disputes are handled, so if it happens to you, just contact the agencies and get it started.
But first, you have to check your credit report and the best place to do that is www.AnnualCreditReport.com, which is a website that was created under the Fair and Accurate Credit Transactions Act (FACTA) to provide a mechanism for American consumers to receive the three free credit reports per year (one from each credit bureau), to which they are entitled under the law. The site is jointly operated by Equifax, Experian, and TransUnion.
Now here is Quizzle’s graph:

Image credit: Quizzle.


