M-Pesa by the Numbers

A new study looks into M-Pesa’s experience in Kenya and Tanzania and examines the factors that have impacted the different adoption rates of the service in these two countries. It’s a subject that I know is of interest to many of you and I thought I’d share the new data.
Furthermore, when looking into M-Pesa’s early adopters in both countries, the authors have discovered a commonality that came as a surprise to me. It turns out that M-Pesa — service that was designed primarily to provide financial services to the unbanked — had to first win over consumers who were already “banked”, before it could win the trust of those outside of the traditional financial system. Banked consumers, we learn, tend to have higher incomes than their unbanked counterparts, and so can more easily afford to risk trying a new financial service. Let’s take a closer look at the paper.
Kenya vs. Tanzania
M-Pesa’s adoption rate has been much higher in Kenya than in Tanzania. The authors tell us that 14 months after its launch, M-Pesa had 2.7 million, but only 280,000 in Tanzania. But why were Tanzanians slower to take up the new service than their northern neighbors? The study carefully reviews a host of factors, but let me highlight the ones that jumped out at me the most.
1. Urbanization. The authors begin their comparison by looking into the two countries’ urbanization level. Kenya’s share of the urban population is higher than Tanzania’s: 41 percent vs. 30 percent. People living in higher-income urban centers maintain ties with family in the countryside, which “has led to a dominant urban to rural remittance corridor in Kenya, accounting for up to 70% of all domestic remittances”. Such a pattern did not exist in Tanzania, we learn.
2. Economic development. Kenya has a GDP of $890 per capita, while Tanzania has $520, a significant difference. More importantly, Kenya also has a better developed financial system, with 1.38 bank branches per 100,000 inhabitants, compared to only 0.57 in Tanzania.
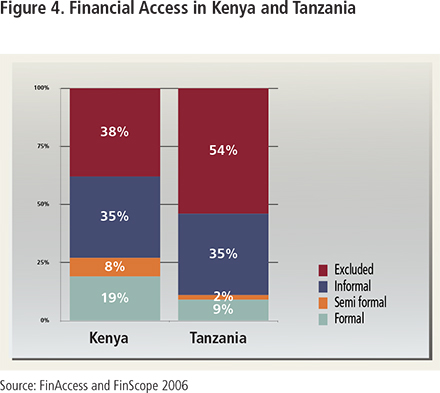
3. Financial access. 38 percent of adult Kenyans didn’t use any form of financial service prior to the launch of M-Pesa. In Tanzania the ratio was 54 percent. The study cites a 2006 Finscope survey, which found that “[m]ore than half the total population [in Tanzania] has never heard of a debit card, an ATM machine or even a current account” (see chart below). Why is this important? Well, according to another survey, cited in the one under discussion, early adopters in both countries were more likely to be banked than unbanked. And as the share of banked consumers in Kenya was significantly higher, so was M-Pesa’s rate of adoption in that country.
4. Previous methods of money transfer. On this metric, the difference between the two countries is less pronounced than it is on any of the previous ones. The proportion of Kenyans sending money inside their country prior to M-Pesa’s launch was 17 percent, compared to 13 percent in Tanzania. In both countries, the preferred method of sending money to others was through friends or family members. Here is the full picture in Kenya:
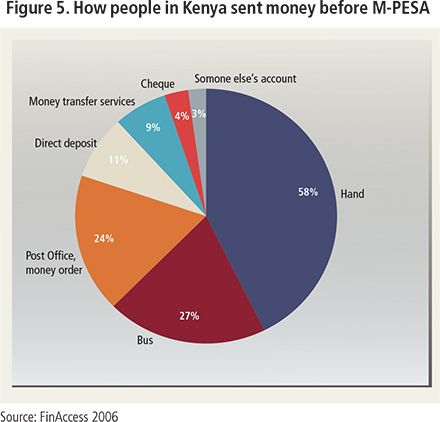
And here is how Kenyans were sending money after the launch of M-Pesa:
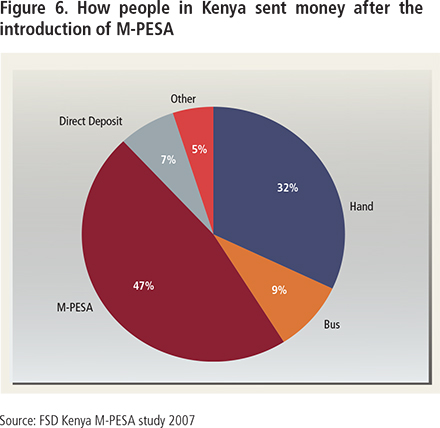
5. Mobile phone ownership. This one is perhaps the most significant difference between the two countries. The authors have found that 27 percent of Kenya’s adults owned a mobile phone prior to the launch of M-Pesa; the corresponding figure for Tanzania was just 15 percent. Additionally, 28 percent of Kenyans used someone else’s phone, compared to 14 percent of Tanzanians. That difference alone goes a long way toward explaining the slower take-up of the new money transfer service in Tanzania. After all, if you don’t have access to a mobile phone, you can’t use M-Pesa.
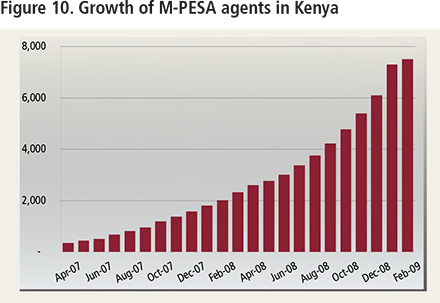
6. Agent network. On this measure, Kenya’s advantage is once again quite significant. 14 months after its launch, M-Pesa had almost 3,000 agents in Kenya, but only 1,000 in Tanzania. Here is how M-Pesa’s agent network in Kenya grew in the first 22 months after the launch of the service:
7. Cost. M-Pesa’s fee structure in Kenya is slightly different from Tanzania’s and it’s difficult to make a direct comparison, but we are told that “[f]or the most popular amount sent, which is about US $20 in both countries, Safaricom [Kenya] charges 3.6% and Vodacom [Tanzania] 4.5% of the amount sent.” The authors’ conclusion is that the cost of transferring money in the two countries is “broadly similar and substantially lower than other alternatives”.
The Takeaway
So here is the study’s conclusion that was most surprising to me:
M-PESA was designed as a service for the unbanked in emerging markets. However, the service cannot function without the presence of the formal financial sector. Bank branches are a vital part of the cash management operation of an M-PESA agent. Secondly, the early adopters of the service in Kenya and Tanzania were more likely to be banked than non users. Higher income individuals are in a better position to risk trying a new service. Having a larger proportion of the population using formal or semi formal financial services may mean a larger pool of early adopters.
Go read the whole paper; there is a lot to be learned.
Image credit: IFC.org.

