U.S. Household Debt up by Most since 2008

Americans increased their overall indebtedness in the third quarter of this year, we learn from the latest Household Debt and Credit quarterly report, issued by the Federal Reserve Bank of New York. It was the biggest increase in household debt since the financial crisis of 2008 and only the second uptick in the past eighteen quarters. Yet, the total amount of household debt is still well below the peak reached on the eve of Lehman’s collapse.
Both the mortgage and non-housing components of the total increased by healthy amounts for the period, with the expansion in the latter category once again fueled primarily by gains in auto and student loans. Aggregate outstanding credit card balances rose only modestly and the total of home equity lines of credit (HELOC) actually fell — the only debt category to decline in the third quarter.
Using data from Equifax, one of the three national credit bureaus, the NY Fed reports that the number of consumers with a bankruptcy notation on their credit files fell by a healthy amount from the previous quarter’s level and the same was the case with foreclosures. The overall delinquency rate also fell considerably on a quarterly basis, although there were substantial increases in HELOC and student loan delinquencies. Let’s take a closer look at the latest numbers.
U.S. Consumer Debt up by $127B
The NY Fed reports that, as of September 30, 2013, the aggregate amount of U.S. household debt was $11.28 trillion. That is up by $127 billion (1.1 percent) from the corresponding total measured at the end of the previous quarter. The authors are quick to point out that the new total is still lower by $1.4 trillion (11 percent) than the all-time high of $12.68 trillion recorded in the third quarter of 2008, at the end of which the fall of Lehman Brothers set off the financial crisis.
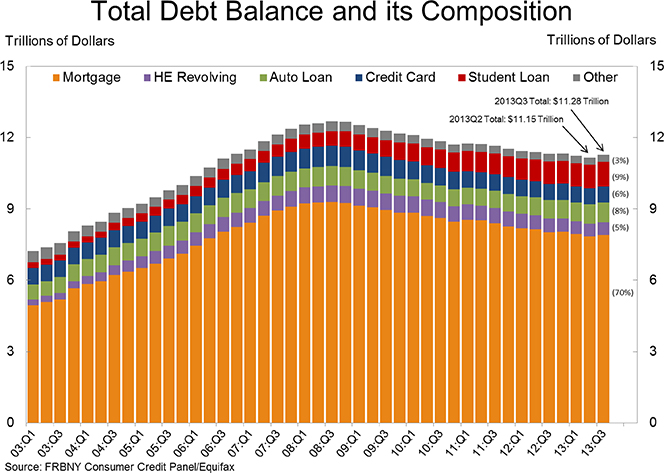
The overall delinquency rate also fell considerably in 2013 Q3, the eight consecutive quarter of improvement. As of the end of September, 7.4 percent ($831 billion) of all outstanding household debt was in some stage of delinquency, down from 7.6 percent ($845 billion) in 2013 Q2 and from 8.1 percent (909 billion) in 2013 Q1. Just under three-quarters — $600 billion — of that total was “seriously delinquent”, meaning at least 90 days overdue, down from $635 billion in the previous quarter and from $678 billion in 2013 Q1, the NY Fed tells us.
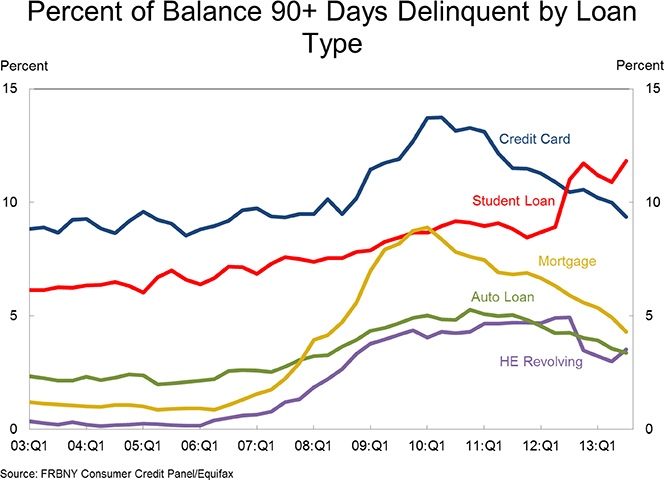
As you can see in the chart below, the delinquency rates of most consumer loan types tracked by the NY Fed, including mortgages and credit cards, fell. However, student loan and HELOC delinquencies rose sharply.
Mortgages, Credit Card Debt, Student and Auto Loans Up
Now here are the numbers for mortgages, credit cards and student and auto loans.
Mortgages
- Originations, or new mortgage balances that appeared on consumer credit reports in the quarter, dropped slightly to $549 billion from the previous quarter’s level.
- Just fewer than 168,000 consumers had a new foreclosure notation added to their credit reports during the third quarter. That is down from 200,000 in the previous quarter and is the lowest number recorded since the end of 2005.
- The share of mortgage balances late by 90 days or more was 4.3 percent during 2013 Q3, down from 4.9 percent in the previous quarter and the lowest level since the second quarter of 2008 (4.2 percent).
Credit Cards
- Aggregate credit card limits were up by $34 billion from the previous quarter’s level to $2.835 trillion. That is still down by 23.4 percent ($865 billion) from the peak of $3.7 trillion recorded in 2008 Q3.
- Available credit was up by $30 billion to $2.163 trillion, but is still down by just under a quarter ($679 billion) from the 2008 Q3 high of $2.842 trillion.
- The number of open credit card accounts rose by 2.3 million to 391.2 million, a level that is still 21.1 percent below the 2008 Q2 peak of 496 million.
- Outstanding credit card balances rose by $4 billion to $672 billion, still 22.4 percent below the 2008 Q4 peak of $866 billion.
- The share of credit card balances delinquent by 90 days or more fell by 63 basis points to 9.36 percent — the lowest level since 2007 Q3.
Student Loans
- The student debt total rose by $33 billion to $1,027 billion, which is up by 68 percent from the $611 billion level of Q3 2008.
- Since the peak of household debt in 2008 Q3, the student debt total has increased by $416 billion, while the other forms of debt have fallen by a combined $1.8 trillion.
- The share of the student debt total delinquent by 90 days or more, having fallen unexpectedly to 10.9 percent in the previous quarter, rose to an all-time record-high of 11.83 percent in 2013 Q3.
Auto Loans
- The auto loan total was up by $31 billion in the quarter to $845 billion — a new all-time high. The previous record — $818 billion — was recorded in 2007 Q3. Overall, in the last ten quarters, auto loan debt has increased by $139 billion.
- New auto loan originations rose by $5.5 billion to $97.4 billion — the highest level since 2006 Q3 ($104.1 billion).
- The share of auto loan balances delinquent by 90 days or more kept falling, ending the quarter at 3.37 percent, down by 20 basis points from the previous quarter and the lowest showing since 2008 Q2 (3.26 percent).
As already noted, HELOC balances were the only exception, falling by $5 billion for the quarter.
The Takeaway
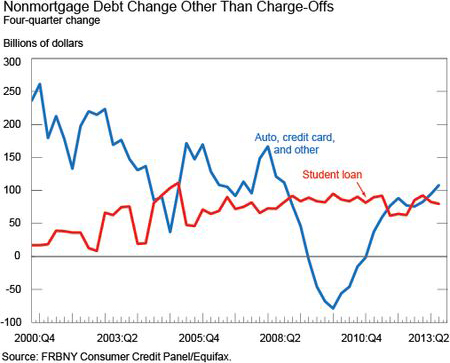
In a blog post, three NY Fed researchers have taken a closer look at the latest data and have produced a couple of charts to show four-quarter changes in the balances of mortgage and non-mortgage debt after removing the effects of defaults. Here are the changes in non-mortgage debt:
And here are the changes in outstanding mortgage balances.
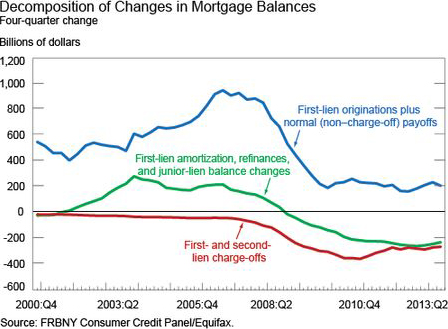
And now here is how the researchers interpret the data:
Rising nonmortgage balances, combined with diminishing effects of mortgage pay-down, suggest that household deleveraging is decelerating. Indeed, when we combine the green line from the mortgage chart with the red and blue lines from the nonmortgage chart, we find that the sum is getting quite close to positive territory.
In other words, the debt deleveraging process may have already run its course.
Image credit: Flickr / StockMonkeys.com.


