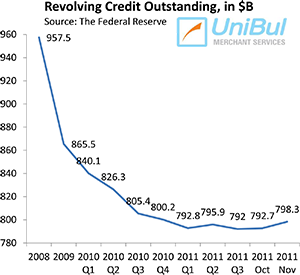
Americans Shed Debt, but not Quickly Enough

The comparison between the level and composition of debt carried by younger and older Americans has been preoccupying a number of researchers in recent months and we have learned quite a bit as a result. For example, Lucia Dunn of Ohio State University and Sarah Jiang of Capital One Financial told us that Americans born between 1980 and 1984 carry credit card debt that is on average $5,689 higher than that of their “parents” (people born between 1950 and 1954) and $8,156 higher than that of their “grandparents” (people born between 1920 and 1924). Then thinktank Demos released a study, which painted a more complicated picture. Yes, older Americans are far less likely to rely on their credit cards to pay for basic cost-of-living expenses than their children and grandchildren, the Demos researchers confirmed, but they are far more likely to use plastic for protection against economic instability and to pay for medical expenses. As a result, Americans older than 50 now owe more on credit cards than consumers younger than 50.
Now the Pew Research Center has released a report on the subject. It tells us that, having taken on record amounts of debt in the run-up to the financial crisis of 2007 — much like everyone else did — younger Americans — defined as those under the age of 35 — have been much quicker than older consumers to reduce their debt burden during the Great Recession. However, the researchers have also found that even as the debt deleveraging process that began with the Great Recession is still ongoing, in relation to incomes Americans’ indebtedness is still growing.
Americans Under 35 Cut Debt by 29% During Great Recession
From 2007 to 2010, the median debt of households headed by a person younger than 35 fell by 29 percent — from $21,912 to $15,473. By comparison, among households headed by a person aged 35 or older, the decline was just 8 percent — from $32,543 to $30,070. Moreover, the share of younger households carrying debt of any kind fell to 78 percent, the lowest level since the government began collecting such data in 1983.
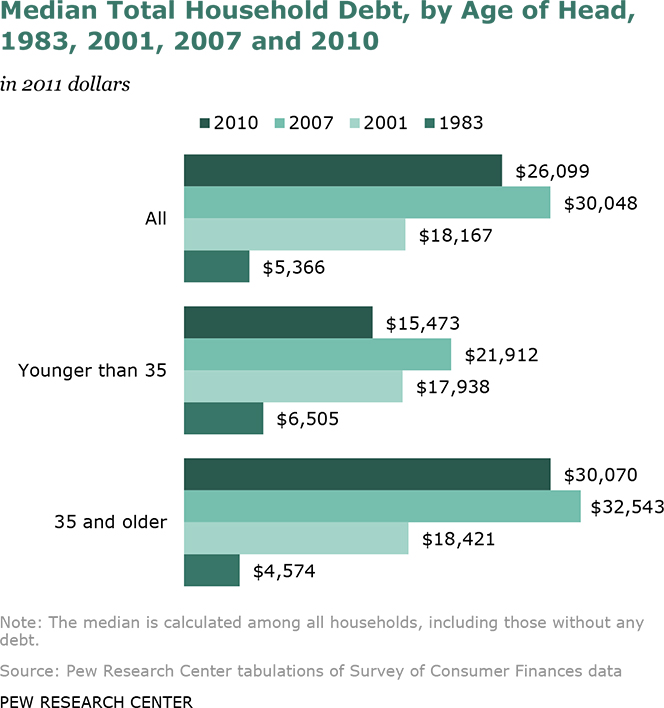
As you see, from 2001 to 2010 younger households have reduced their overall indebtedness — from $18,000 to $15,000 — whereas the reverse is true for those headed by a person aged 35 or older, whose debt has increased from $18,000 in 2001 to $30,000 in 2010.
Mortgage Debt Biggest Factor in Overall Indebtedness
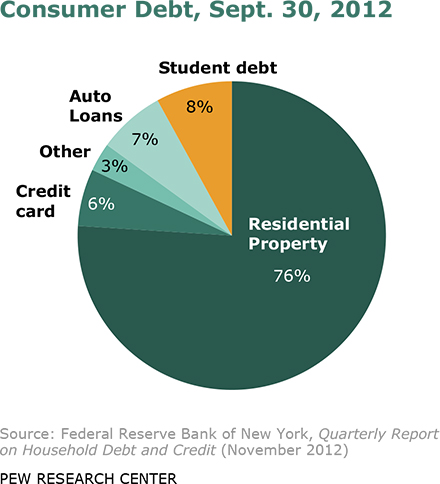
“Changes in total debt almost invariably involve mortgage debt and the ownership of homes”, the researchers remind us. Home-related debt is the single biggest type of debt, accounting for 76 percent of all consumer debt outstanding as of the third quarter of 2012:
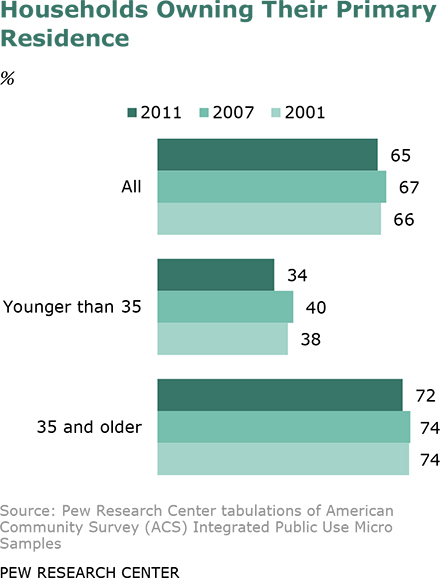
Among younger Americans, the share of households owning their primary residence fell sharply from 40 percent in 2007 to 34 percent in 2011. The median outstanding amount of residential property-related debt they owed fell from about $150,000 in 2007 to $128,000 in 2010 — a decline of 14.7 percent. Among older Americans, the fall in home ownership for the 2007-2011 period was much less steep — from 74 percent to 72 percent.
Fewer Younger Americans Own a Car
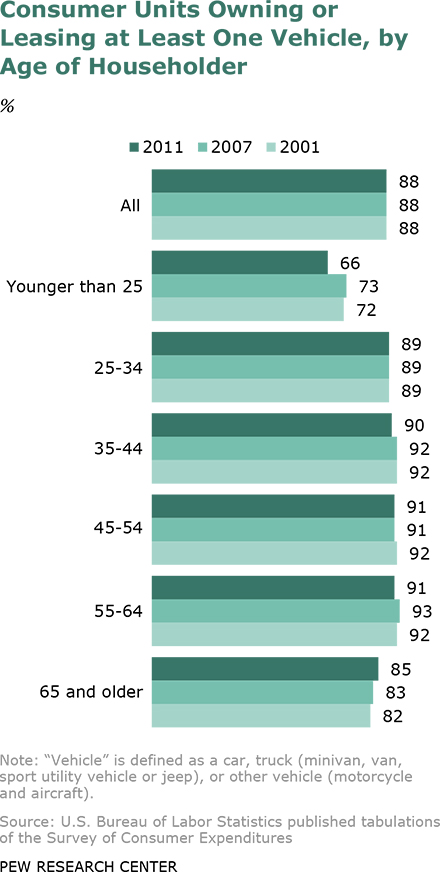
Whereas the overall rate of car ownership has held steady between 2001 and 2011, fewer Americans under the age of 25 owned a car in 2011 than they did in 2001, we learn. Here is the chart:
Non-Household Debt
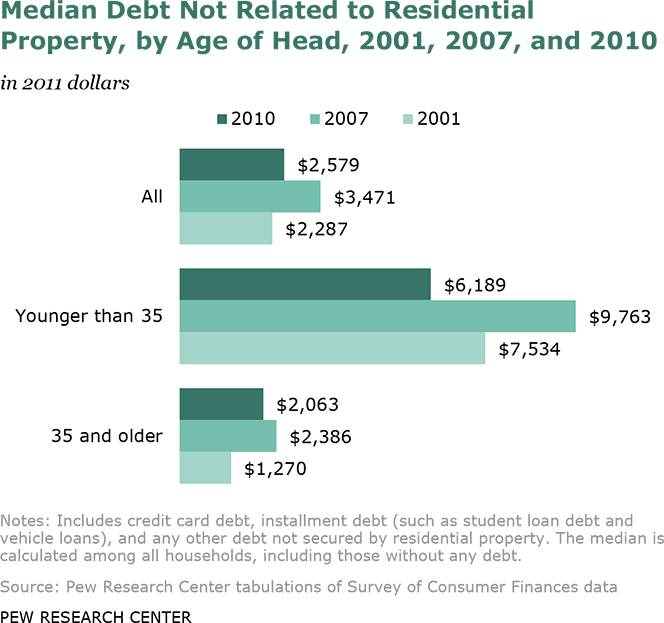
As we already saw, debt related to homes accounted for more than three-quarters of Americans’ overall indebtedness at the end of the third quarter of 2012 and so much of the decline in debt among younger households is due to the fact that fewer of them owned homes and had a mortgage than they did in 2001. However, whereas among younger Americans, there has also been a decline in debt not related to residential property, the reverse is true for the over-35 group, as you can see in the chart below:
Distribution of Debt
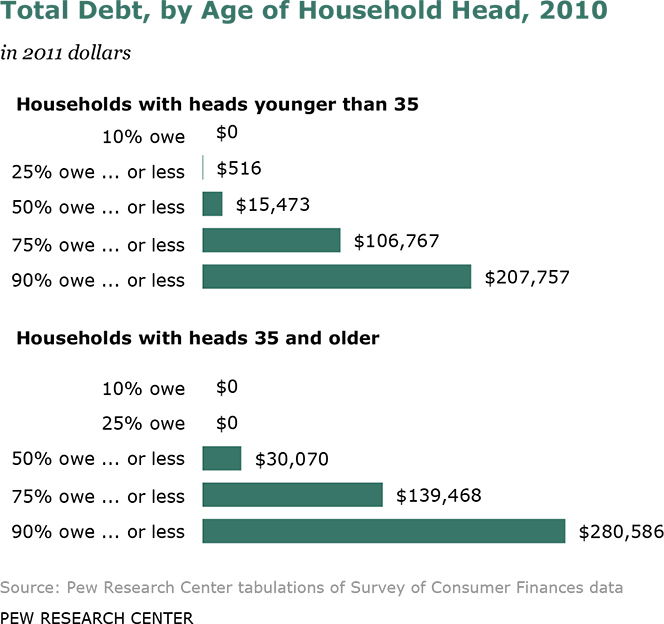
A quarter of all Americans in each of the examined groups owed either nothing, in the case of the over-35 group, or very little ($516, to be precise), in the case of the younger segment of the population. However, a significant proportion of the population in both groups owed much larger amounts, as seen in the chart below:
Debt-to-Income Ratio Rises
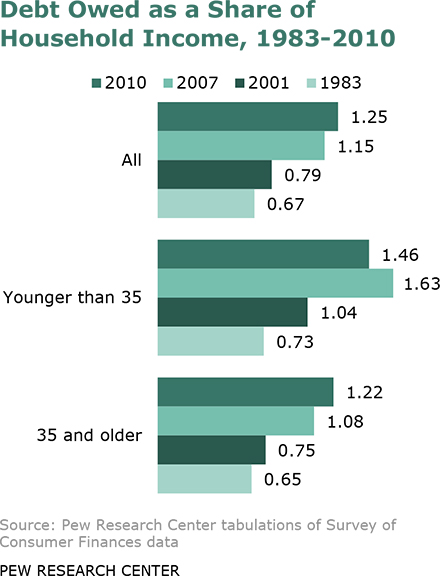
And, finally, here is what must be the most important finding and what I believe should have been Pew’s headline chart. Whereas younger Americans reduced their debt in absolute terms, we learn, their household incomes have also declined since 2001 and the result is a much worse debt-to-income ratio. The same turns out to be true for the older segment as well. Here is the chart:
The Takeaway
So the bottom line is that, even after all the debt reduction that has taken place since the Great Recession began, Americans are still in a worse financial shape than they were a decade ago. The debt-to-income ratio of American households has spiked by 58 percent between 2001 and 2010! The increase has been greater in the over-35 segment of the population — 63 percent — but it has been quite steep in the younger group as well — 40 percent. Yet, there has been a marked decline in the under-35’s ration in the 2007-2010 period (but not in the over-35 segment), so the trend may be reversing itself. We shall see.
Image credit: Utcourts.gov.


