The Evils of Payday Lending Visualized

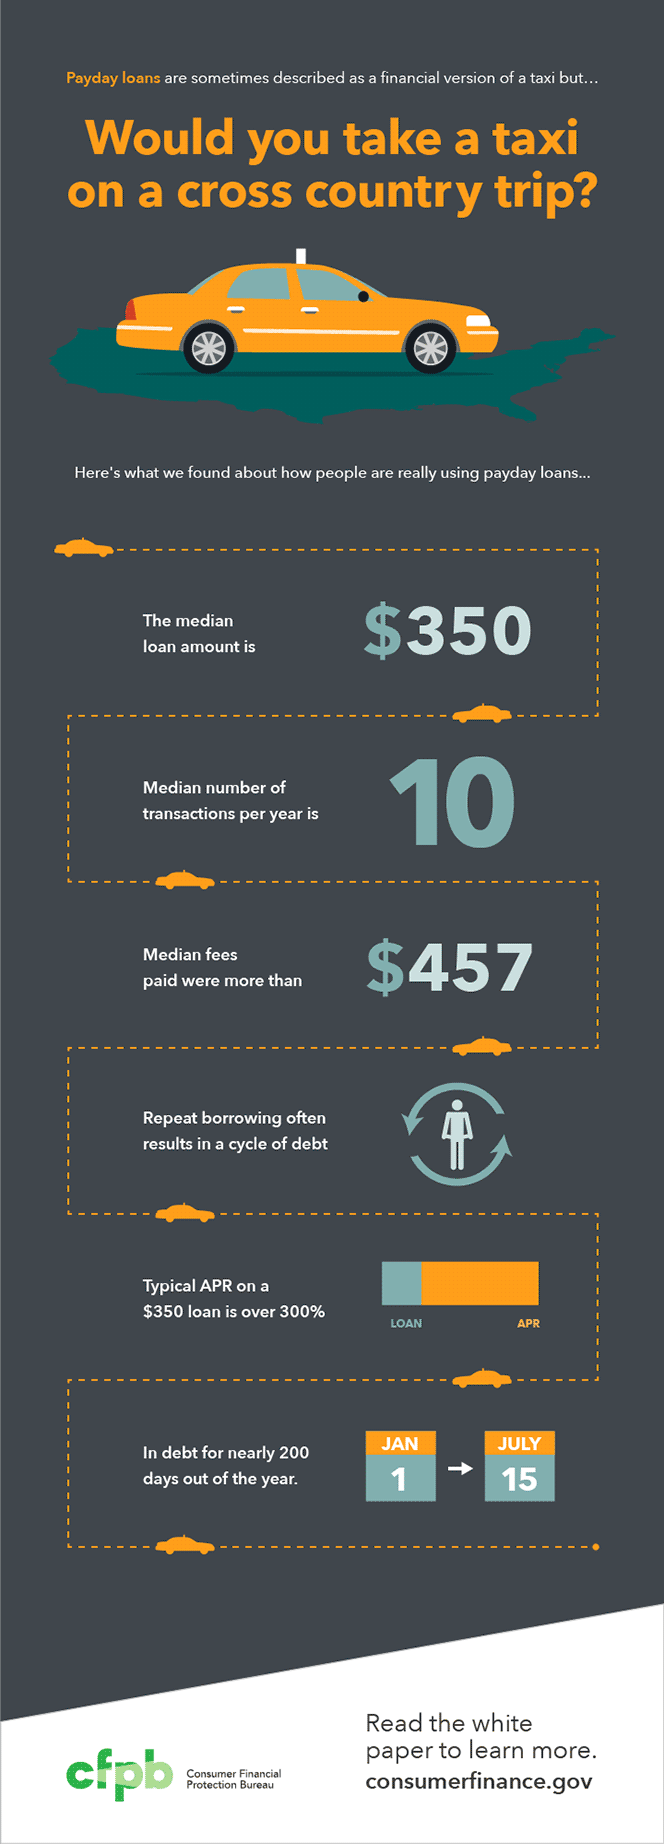
In my recent post on the current state of payment processing for the U.S. payday lending industry, I referred to an amusing infographic, produced by the Consumer Financial Protection Bureau (CFPB) and designed to illustrate just how bad of a financial decision the taking of a payday loan really is. Well, having published the post, I started wondering what other graphs people might have been creating to drive the point home and thought I should check.
Sure enough, I wasn’t disappointed. People have been really busy thinking up ways of visualizing the evils of taking out payday loans and of demonizing the lenders themselves. Interestingly, most of the graphs I found came from across the Atlantic — it seems as though the Brits may have a bigger payday fetish than our own payday bashers (perhaps an even bigger one than New York Attorney General Eric Schneiderman’s, if at all possible).
I had fun with some of the graphs and thought you might as well, so I decided to share them with you. Here they are.
How Payday Loans Work
The Pew Charitable Trusts gives us their version of the payday loan cycle in the graph below. It does present a plausible picture of reality.

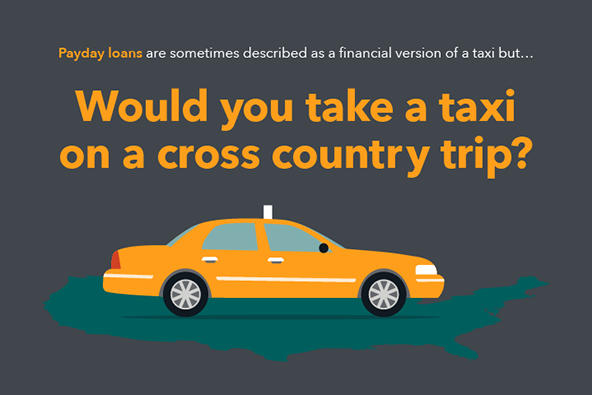
Would You Take a Taxi on a Cross Country Trip?
Yes, the CFPB’s taxi graph is my favorite. It gives us some top-line payday statistics for the U.S., but the headline, catchy though it may be, is misleading in the extreme. It makes it sound as though payday borrowers have multiple options and are making the wrong choice. After all, you wouldn’t take a taxi on a cross country trip, because you can drive your own car or fly, or take a bus or train. Well, payday borrowers rarely enjoy the luxury of choice, because most of them are cut off from the traditional financial system.

Payday Loans Are Unaffordable
Yes, that is what another graph from The Pew Charitable Trusts tells us. People cannot afford to pay back more than 5 percent of their paychecks, we are informed, and yet, a typical payday loan takes a third of it. Naturally, borrowers “want reform”, the graph declares. Reform always sounds good, doesn’t it? Any particulars on what such a reform might look like? Well, here it is: borrowers want more time to repay their loans and more regulation. Now, I challenge you to find a single borrower, payday or otherwise, who would not ask for more time to pay back her debt. And of course regulation, whatever the particulars, is always needed.

Should I Get a Payday Loan?
Then we have Toptenreviews.com showing us how the costs of payday loans explode over time. Make of it what you will.

Who Takes out a Payday Loan?
Now let’s cross the Atlantic to see what the Brits are doing with their payday loans. To begin with, here is what Peachy.co.uk has to say about who takes out such loans. Among other things, we learn that payday borrowers are equally likely to be male as they are to be female, they prefer applying online and 71 percent of them have taken three or more such loans in their lives. Here is the graph:

U.K. Payday Stats
Finally, Cheeky Payday — a British lender — gives us “some interesting facts and figures about the Payday Loans industry in the UK”. Among other things, we learn that the “last two years has seen a huge increase in the average payday loan” in the U.K. Other than that, the figures are pretty similar to the ones in the U.S.

So, there it is. Of course, there are quite a few graphs that I could have added to this list, but I didn’t want to make it too long and, in any case, the overall impression would not have changed.
Image credit: CFPB.


