On Debt, Credit Scores, the North-South Divide and Making Payments on Time

Did you know that women rate financial responsibility as equal to sex and intimacy when searching for a partner? Well, neither did I, but that’s what I just read in a beautiful infographic, so it must be true. Furthermore, I learned, a quarter of all men and women consider their partner’s credit score as a deal breaker when considering a marriage.
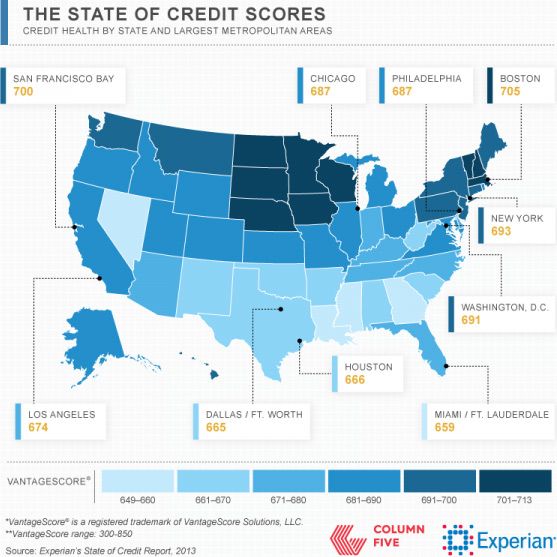
With so much at stake, I thought I’d take a fresh look at the current state of consumer debt and credit scores in the U.S. What I found was that plenty of people have a lot to worry about, and that is especially true for residents of the southern states. Well, I guess I no longer wonder why the latest U.S. Census found that the divorce rates are highest in the South (where the average credit scores are lowest), and are lowest in the Northeast (where the average credit scores are highest). Naturally, I had to share my discoveries with you.
Credit Score Basics
First, let’s have the basics covered. Here is a MortgageKick.com infographic, which does a pretty good job at it.

As you see, payment history — your track record of making payments on time — makes up more than a third of your overall credit score. So you’d think there would be a direct relationship between those two variables. And you’d be right.
Pay on Time for a Higher Credit Score
The good people at Credit Karma have analyzed the data for us and have produced this infographic, which illustrates beautifully the relationship between the timeliness of your payments and your credit score.

As you see, the relationship is clear. And to reiterate, and as the authors themselves note, payment history is an extremely heavily weighted factor in calculating your score — just one missed payment can lead to a huge drop of your score.
Northeast Up, South Down
Now let’s take a look at the average credit score distribution. First here is a nicely illustrated state-by-state breakdown (an infographic by SuretyBonds.com).

So the average credit score for the U.S. as a whole is 687, which also happens to be California’s average. However, there is a clear and quite sizable divide between the Northeast and the South. For a slightly different view, below is a chart of the average credit scores in the ten largest metropolitan areas. And it paints the same picture.

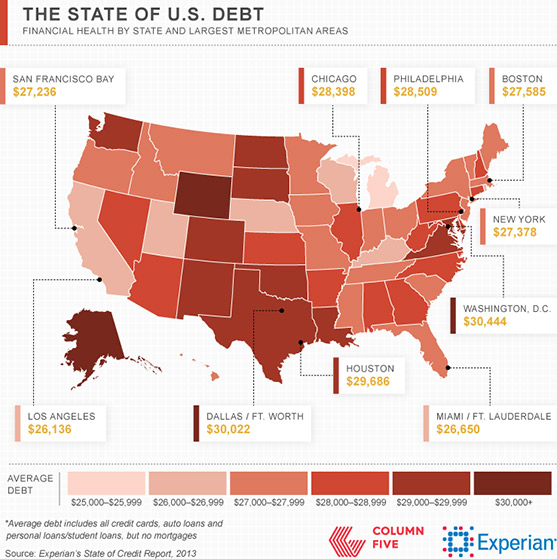
If you’re like me, having seen the credit score distribution charts, you’d be wandering whether or not there is an inverse relationship between average credit scores and debt levels. Well, here is a chart showing the average debt levels for the same ten metropolitan areas whose credit scores we just examined:

So there is no strong inverse relationship to be seen. Yes, Houston’s and Dallas / Fort Worth’ debt levels are significantly higher than Boston’s, but Miami / Fort Lauderdale’s (the area with the lowest average credit score) are lower.
How to Keep Your Credit Score Up
The first two infographics offer some advice on that front and you should follow it. But it’s actually quite simple and it’s all about using common sense. At the end of the day, if you don’t use more credit than you can pay back and you make your payments on time, every time, you’ll be doing just fine. On the other hand, here are three ways to decrease your credit score, quickly:
- Be late on a payment or miss one altogether.
- Use more than 70 percent of the available credit on any one of your credit accounts.
- Apply for every credit card, for which you are pre-approved.
Alternatively, if you really want to kill your credit score and do it immediately, just move to Texas.
Image credit: SuretyBonds.com.


